Analytics
Overview
Analytics is a big data analysis service that helps you track core metrics such as DAU, revenue, and retention based on event data, and maximize marketing efficiency through segment-based metric analysis and targeting.
Note
Click Hive Console > Analytics > Event Analytics and then click the Access Analytics button to get started. Companies that joined Hive Console on or after April 8, 2026 can use it immediately. Companies that joined before that date can request access through technical support.
Data Flow
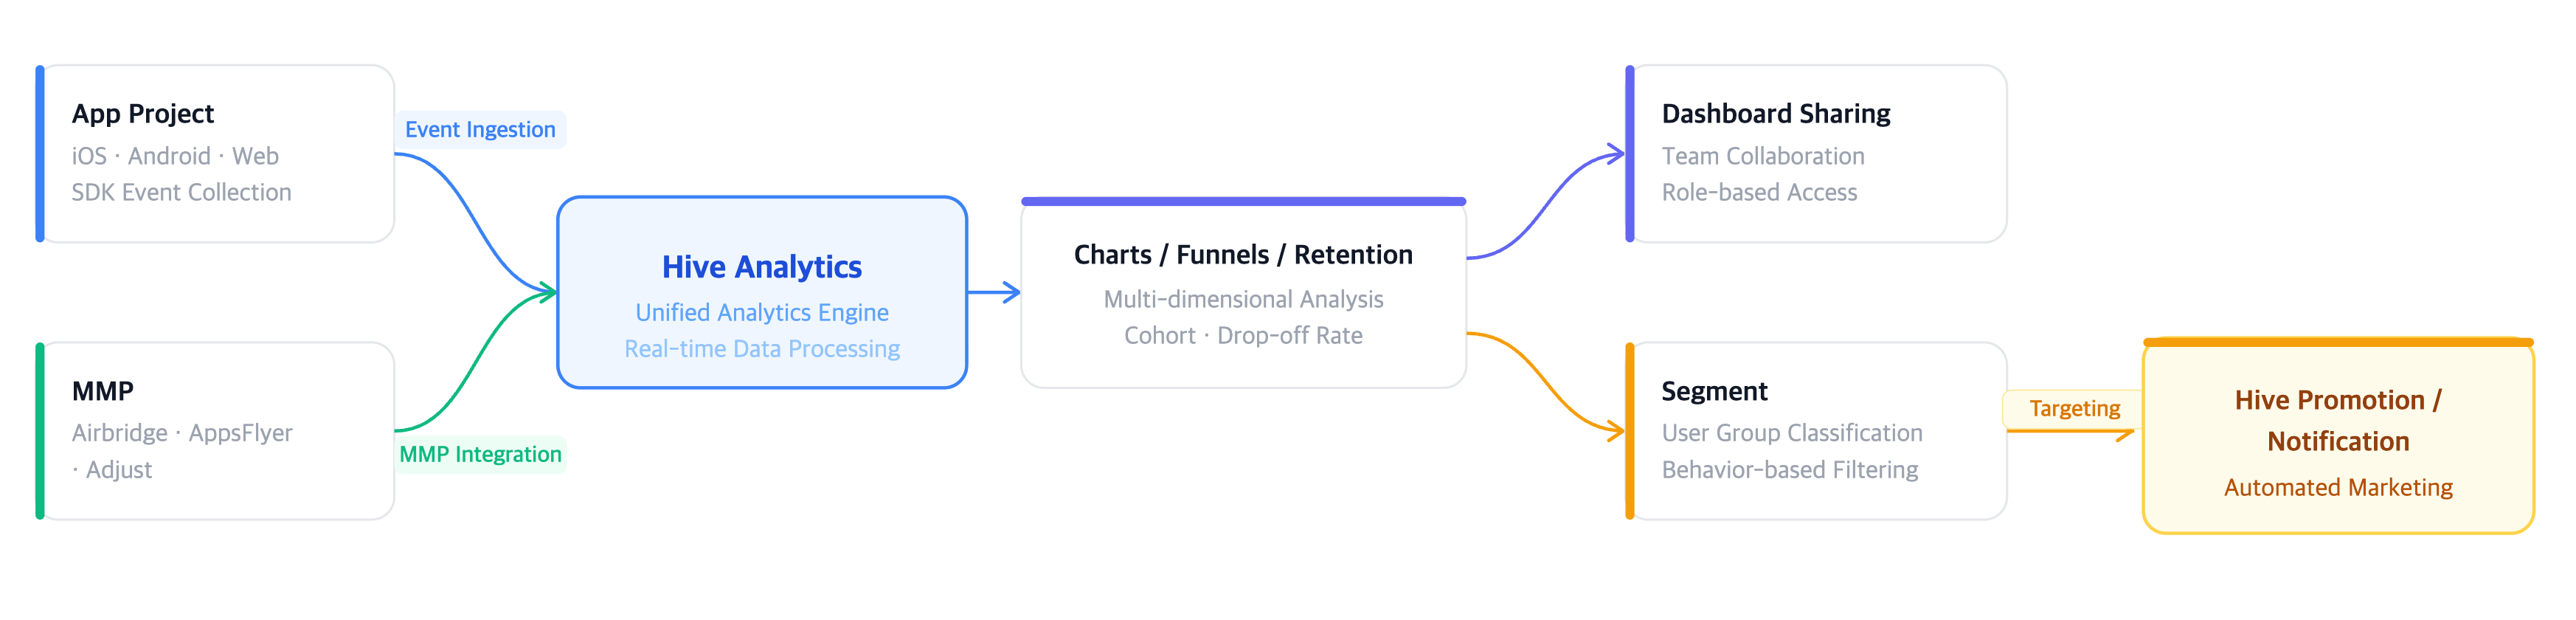
Key Features
- Analyze without code: You can build charts and dashboards instantly just by selecting events and metrics in the UI without SQL or separate scripts.
- Event-based analysis: Even if events are not defined in advance, Analytics can collect them and use them for analysis.
- Unlimited data storage: All event data sent to Analytics can be collected without any storage limit.
- Segments and targeting - Group users by combining desired attribute conditions, and connect with Hive Promotion/Notification products to run targeting campaigns immediately.
- Central metric management: If you save frequently used aggregation settings as Metric, you can apply them in bulk to all connected charts and dashboards when the criteria change.
Role-Based Getting Started Guide
If you are new to Analytics, start in the order that matches the role below.
Business/Marketing Users
This is the recommended starting order for users handling game metric analysis, content performance measurement, and target user extraction.
| Order | Document | Purpose |
| 1 | Workspace Management | Create a dedicated analysis space and set team permissions |
| 2 | Home | Check the core KPI status set in the workspace |
| 3 | Funnel | Analyze high drop-off stages and identify improvements |
| 4 | Retention | Check early engagement and long-term success potential using revisit rate |
| 5 | Chart | Analyze custom metrics by combining desired data conditions |
| 6 | Dashboard | Organize key analysis results on one screen and share them with the team |
| 7 | Segment | Extract condition-based target users and use them for campaigns |
| 8 | User Classification Move | Monitor whale user churn and build strategies to secure genuine users |
| 9 | User Activity Tracking | Check individual user behavior and respond to abuse or inquiries |
Data Analysts
This is the recommended starting order for users handling collected event status, in-depth analysis, and cohort definition.
| Order | Document | Purpose |
| 1 | Event | Review the full status of collected events and attributes, and validate data quality |
| 2 | Metric | Define team-wide KPI metrics |
| 3 | Chart / Funnel / Retention | Perform in-depth analysis by purpose |
| 4 | Segment | Define cohorts and classify target users |
| 5 | User Classification | Check the proportion and status of whale users by user classification type |
| 6 | User Activity Tracking | In-depth analysis of individual user behavior |
Developers
This is the recommended starting order for developers responsible for data environment setup, event integration, and third-party tool management.
Full Features
Main Menu
| Document | Description |
| Home | View dashboards by workspace |
| All Content | View and manage the full content list |
Create
| Document | Description |
| Chart | Visualize data based on events/metrics |
| Funnel | Analyze stage-by-stage conversion and drop-off |
| Retention | Analyze user revisit/retention rates |
| Dashboard | Unified dashboard for content |
| Template | Save and reuse chart templates |
User
Data
| Document | Description |
| Event | Define/manage events and attributes |
| Metric | Define/manage common metrics |
| Integration | Third-party integrations such as MMPs |
| Data Export | Upload event data to cloud storage |
Settings
Common Concept Terms
| Term | Description |
| Workspace | The unit where content such as charts, funnels, retention reports, and dashboards is stored |
| Project | The game being analyzed |
| Event | The basic unit of user activity tracking (for example, login, purchase, level up) |
| Metric | A metric stored based on events (for example, DAU, ARPU) |
| Dimension | An attribute used to group/filter data (for example, country, OS, app version) |
| Segment | A user group defined by combining conditions |
| MMP | Mobile Measurement Partner (Airbridge, AppsFlyer, Adjust, etc.) |
| Identifier | A value used to distinguish users (userId or deviceId) |
Permission Guide
Metric Settings submenus are visible to all users and list viewing is available. However, adding, deleting, and editing are available only to users registered in Settings > Metric Settings > Access Permission Management.
| Menu | View | Add / Delete / Edit |
| Metric Excluded User Management | All users | Users registered in Access Permission Management |
| Metric Filter Management | All users | Users registered in Access Permission Management |
| Currency Settings | All users | Users registered in Access Permission Management |
| Time Settings | All users | Users registered in Access Permission Management |