metric
Overview
Metrics is a function that allows you to save and reuse the settings of frequently used indicators in the Create > Chart menu.
By defining indicators that can be commonly used throughout the company as metrics, indicators from the same source can be exposed with the same numbers. If a metric's criteria changes, you can edit just one metric and it will automatically be reflected in all charts and dashboards that use that metric.
What can you do?
Business/Marketing Manager
- If you define a team common KPI as a metric, such as DAU, MAU, ARPU, etc., all members can share data on the same basis.
- By classifying indicators by purpose into metric categories, you can systematically manage the analysis assets of the entire team.
Data Analyst
- Once complex derived indicators such as ARPPU, PU and PU RATE(%) are saved as metrics, they can be immediately reused without the hassle of setting them repeatedly for each chart.
- Changes to a metric definition are automatically reflected in all charts that use that metric, ensuring consistency.
Get started quickly
If this is your first time creating a metric, follow the steps below to create your first metric.
- Click the Data > Metrics menu on the left sidebar.
- Click the Register button in the top right.
- Enter a metric title and category.
- In the Metrics area, select the events, values, and operations you want to analyze.
- Click the Save button.
Note
For detailed functions such as metric registration, exposure/non-exposure settings, and metric categories, please refer to All functions.
All Features
Key concepts
| concept | Description |
|---|---|
| Metrics | Define metrics that calculate based on events (e.g. COUNT DISTINCT userId for events AU = app_login) |
| Built-in metrics | Metrics provided by default in the analytics system |
| Custom Metrics | Custom metrics defined by analytics users |
| Metric Category | Groups to categorize metrics by type (e.g. users, sales, sessions, gameplay analytics, etc.) |
Built-in metrics
This is a metric provided by default in the analytics system and can be copied and modified to use as a new metric.
In order to use metrics, each event and attribute must be transmitted. For events, refer to Event log transmission, and for attributes, refer to Event attribute transmission.
| Category | metric | Description | Formula (event name, aggregate, attribute, filter) |
|---|---|---|---|
| User | AU | Number of users logged in to the game with duplicates removed | app_login · COUNT DISTINCT · userId |
| AU(deviceId) | Number of deduplicated deviceId logged into the game | app_login · COUNT DISTINCT · deviceId | |
| NU | Number of users who logged in to the game for the first time with duplicates removed | app_login · COUNT DISTINCT · userId · newUser = 'Y' | |
| NU(deviceId) | Number of deduplicated deviceId logs into the game for the first time | app_login · COUNT DISTINCT · deviceId · newUser = 'Y' | |
| Login Hit | Total number of game logins | app_login · COUNT · userId | |
| Number of concurrent users | Number of duplicate users included in events that the game SDK automatically collects every 2 minutes while the client is running. | app_session_maintain · COUNT DISTINCT · userId | |
| Number of Terms and Conditions | The number of duplicates removed from deviceId when running the app for the first time after downloading | terms_agree · COUNT DISTINCT · deviceId | |
| Sales | In-app sales | Sum of payments made in in-app stores | product_purchase · SUM · price |
| Purchase Quantity | Sum of users' in-app store purchases | product_purchase · SUM · quantity | |
| Number of sales | Number of duplicate receipts issued when an in-app store purchase event occurs | product_purchase · COUNT DISTINCT · transactionId | |
| PU | Number of duplicates removed for users who paid in the in-app store | product_purchase · COUNT DISTINCT · userId | |
| ARPU | In-app sales generated per user | ( product_purchase · SUM · price ) / ( app_login · COUNT DISTINCT · userId ) | |
| ARPU(deviceId) | In-app sales generated per deviceId | ( product_purchase · SUM · price ) / ( app_login · COUNT DISTINCT · deviceId ) | |
| ARPPU | Average in-app sales generated per paying user | ( product_purchase · SUM · price ) / ( product_purchase · COUNT DISTINCT · userId ) | |
| PU RATE(%) | Ratio of in-app store payment users to the number of game logged in users (%) | ( (product_purchase · COUNT DISTINCT · userId) * 100 ) / ( app_login · COUNT DISTINCT · userId ) |
View metric list
Check all metrics registered in Analytics as a list. 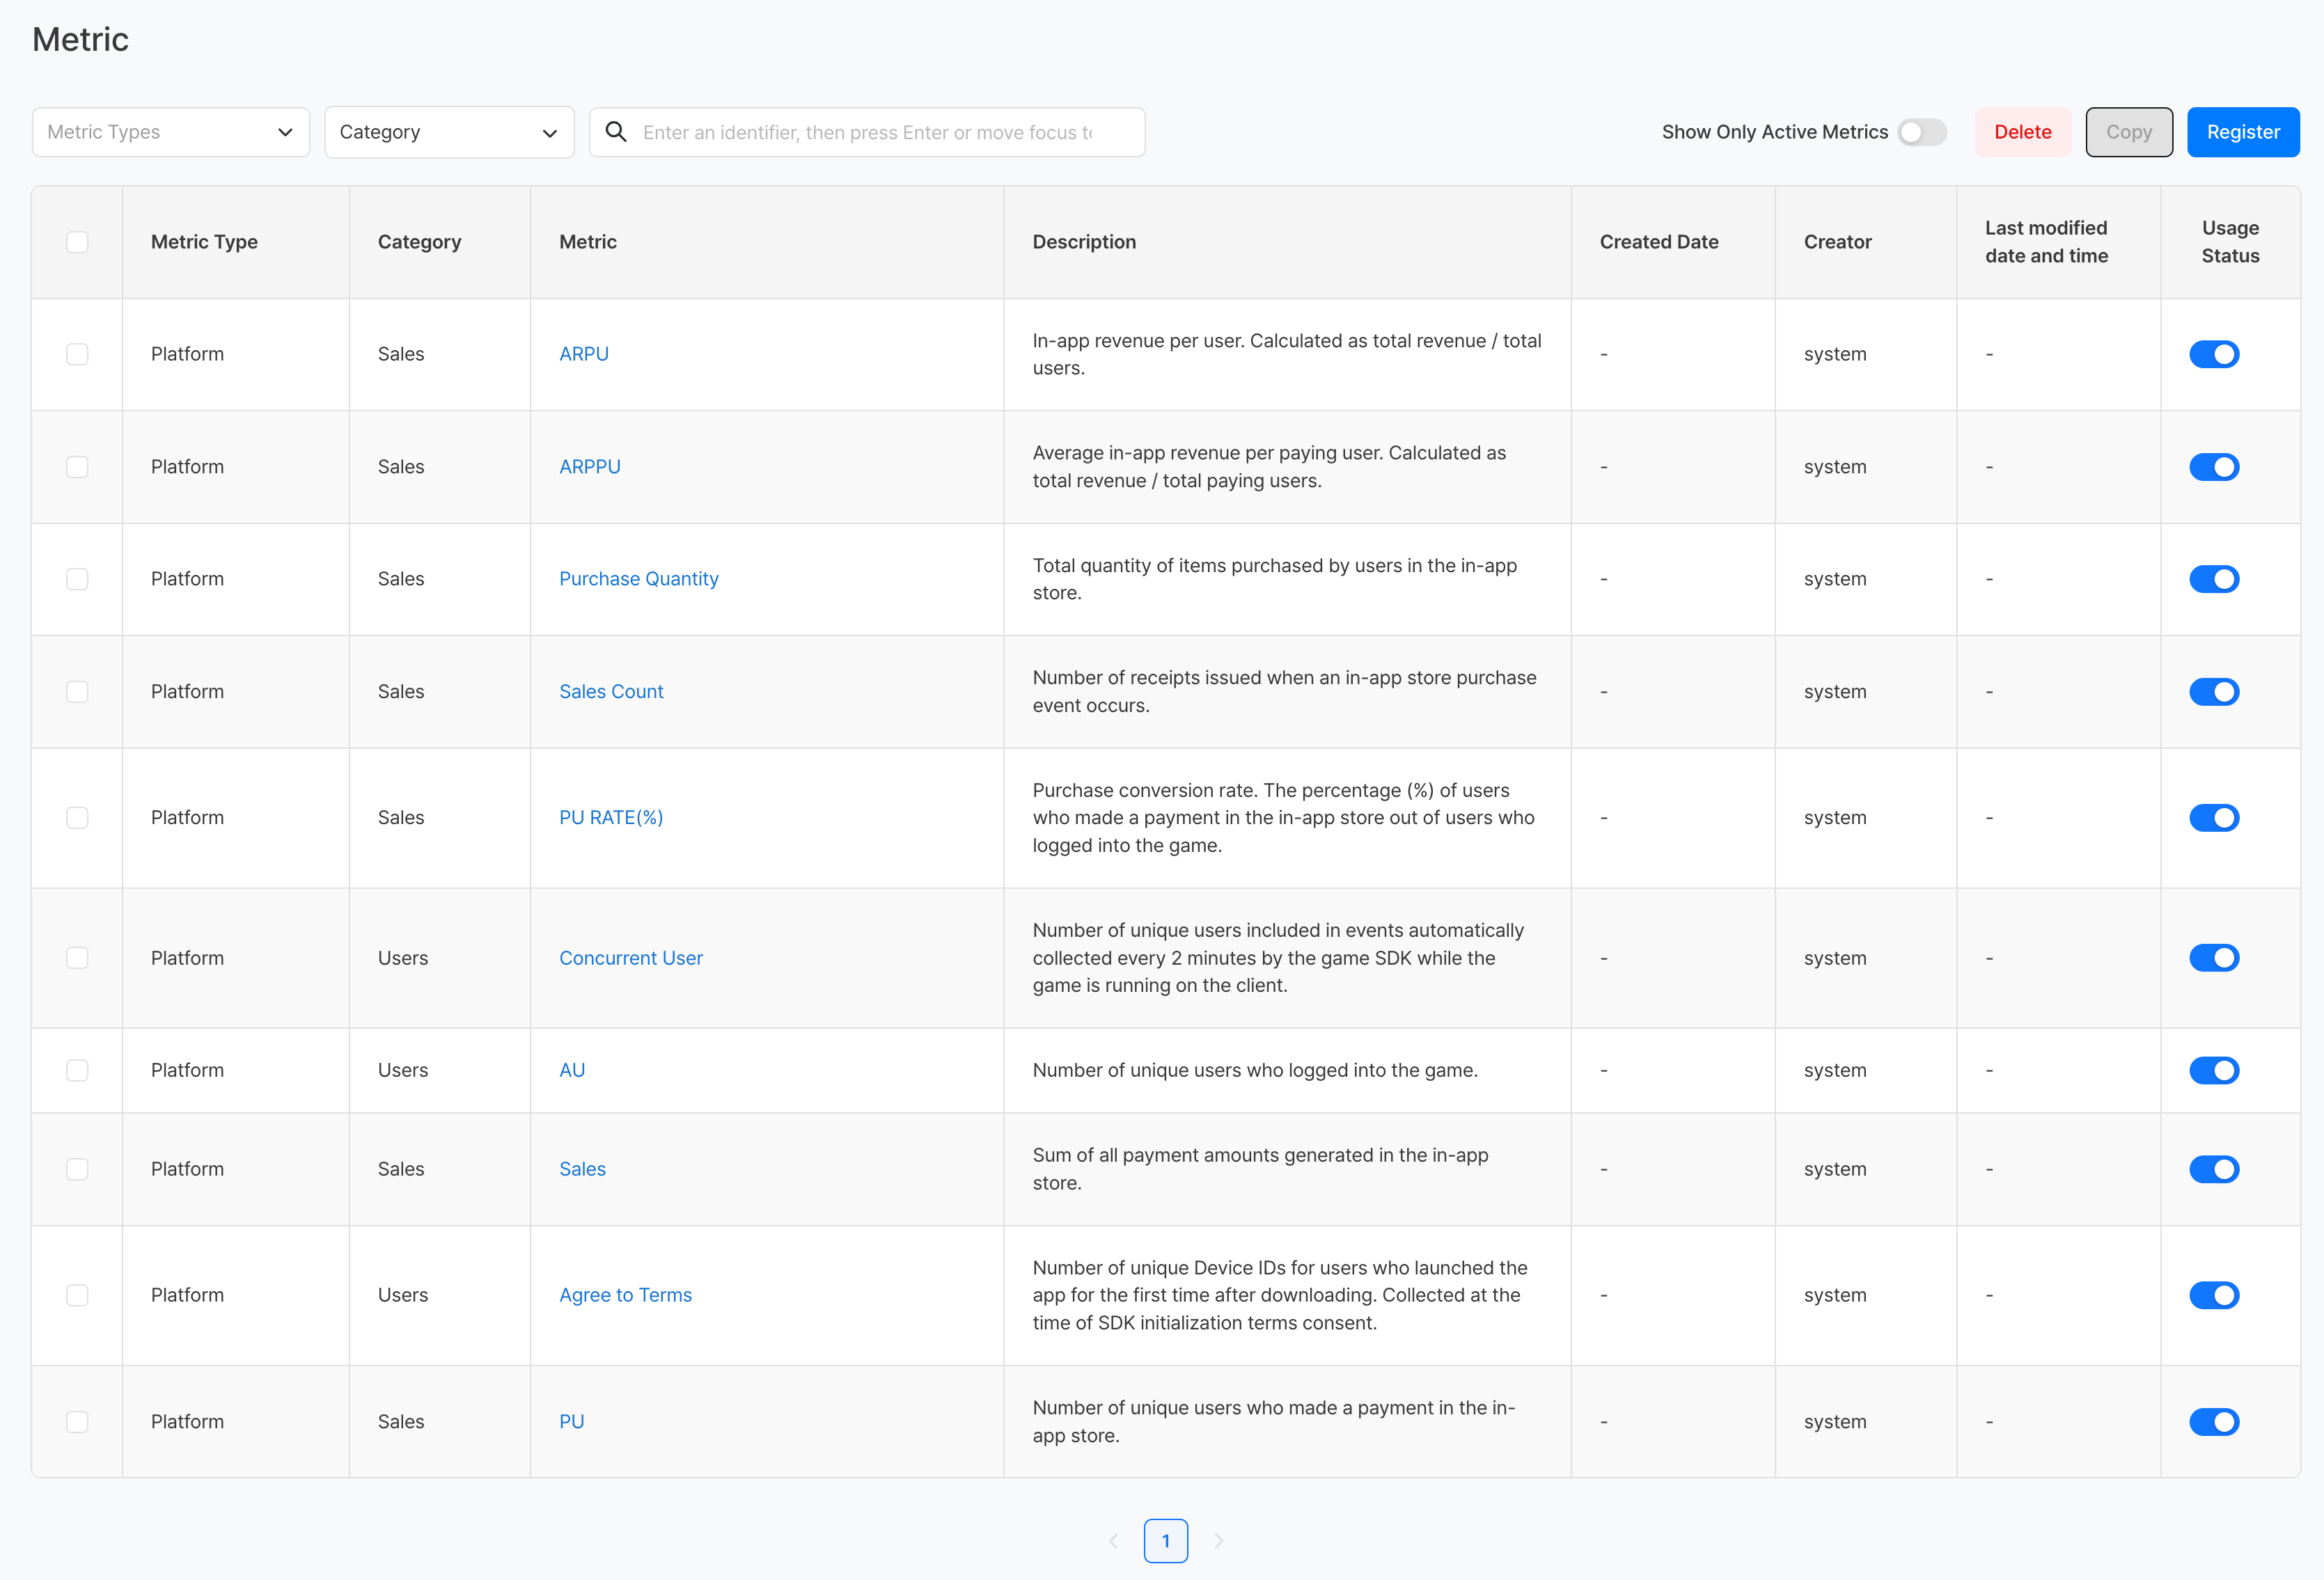
| Display items | Description |
|---|---|
| Metric Type | Distinguish between built-in metrics and user-defined metrics |
| Category | Category the metric belongs to |
| Metrics | Metric name (click to go to detail page) |
| Created date | Date and time the metric was created |
| Generator | User who created the metric |
| Last modified date | When the metric was last modified |
| Use or not | Toggle visibility of metrics in charts |
Create Metric
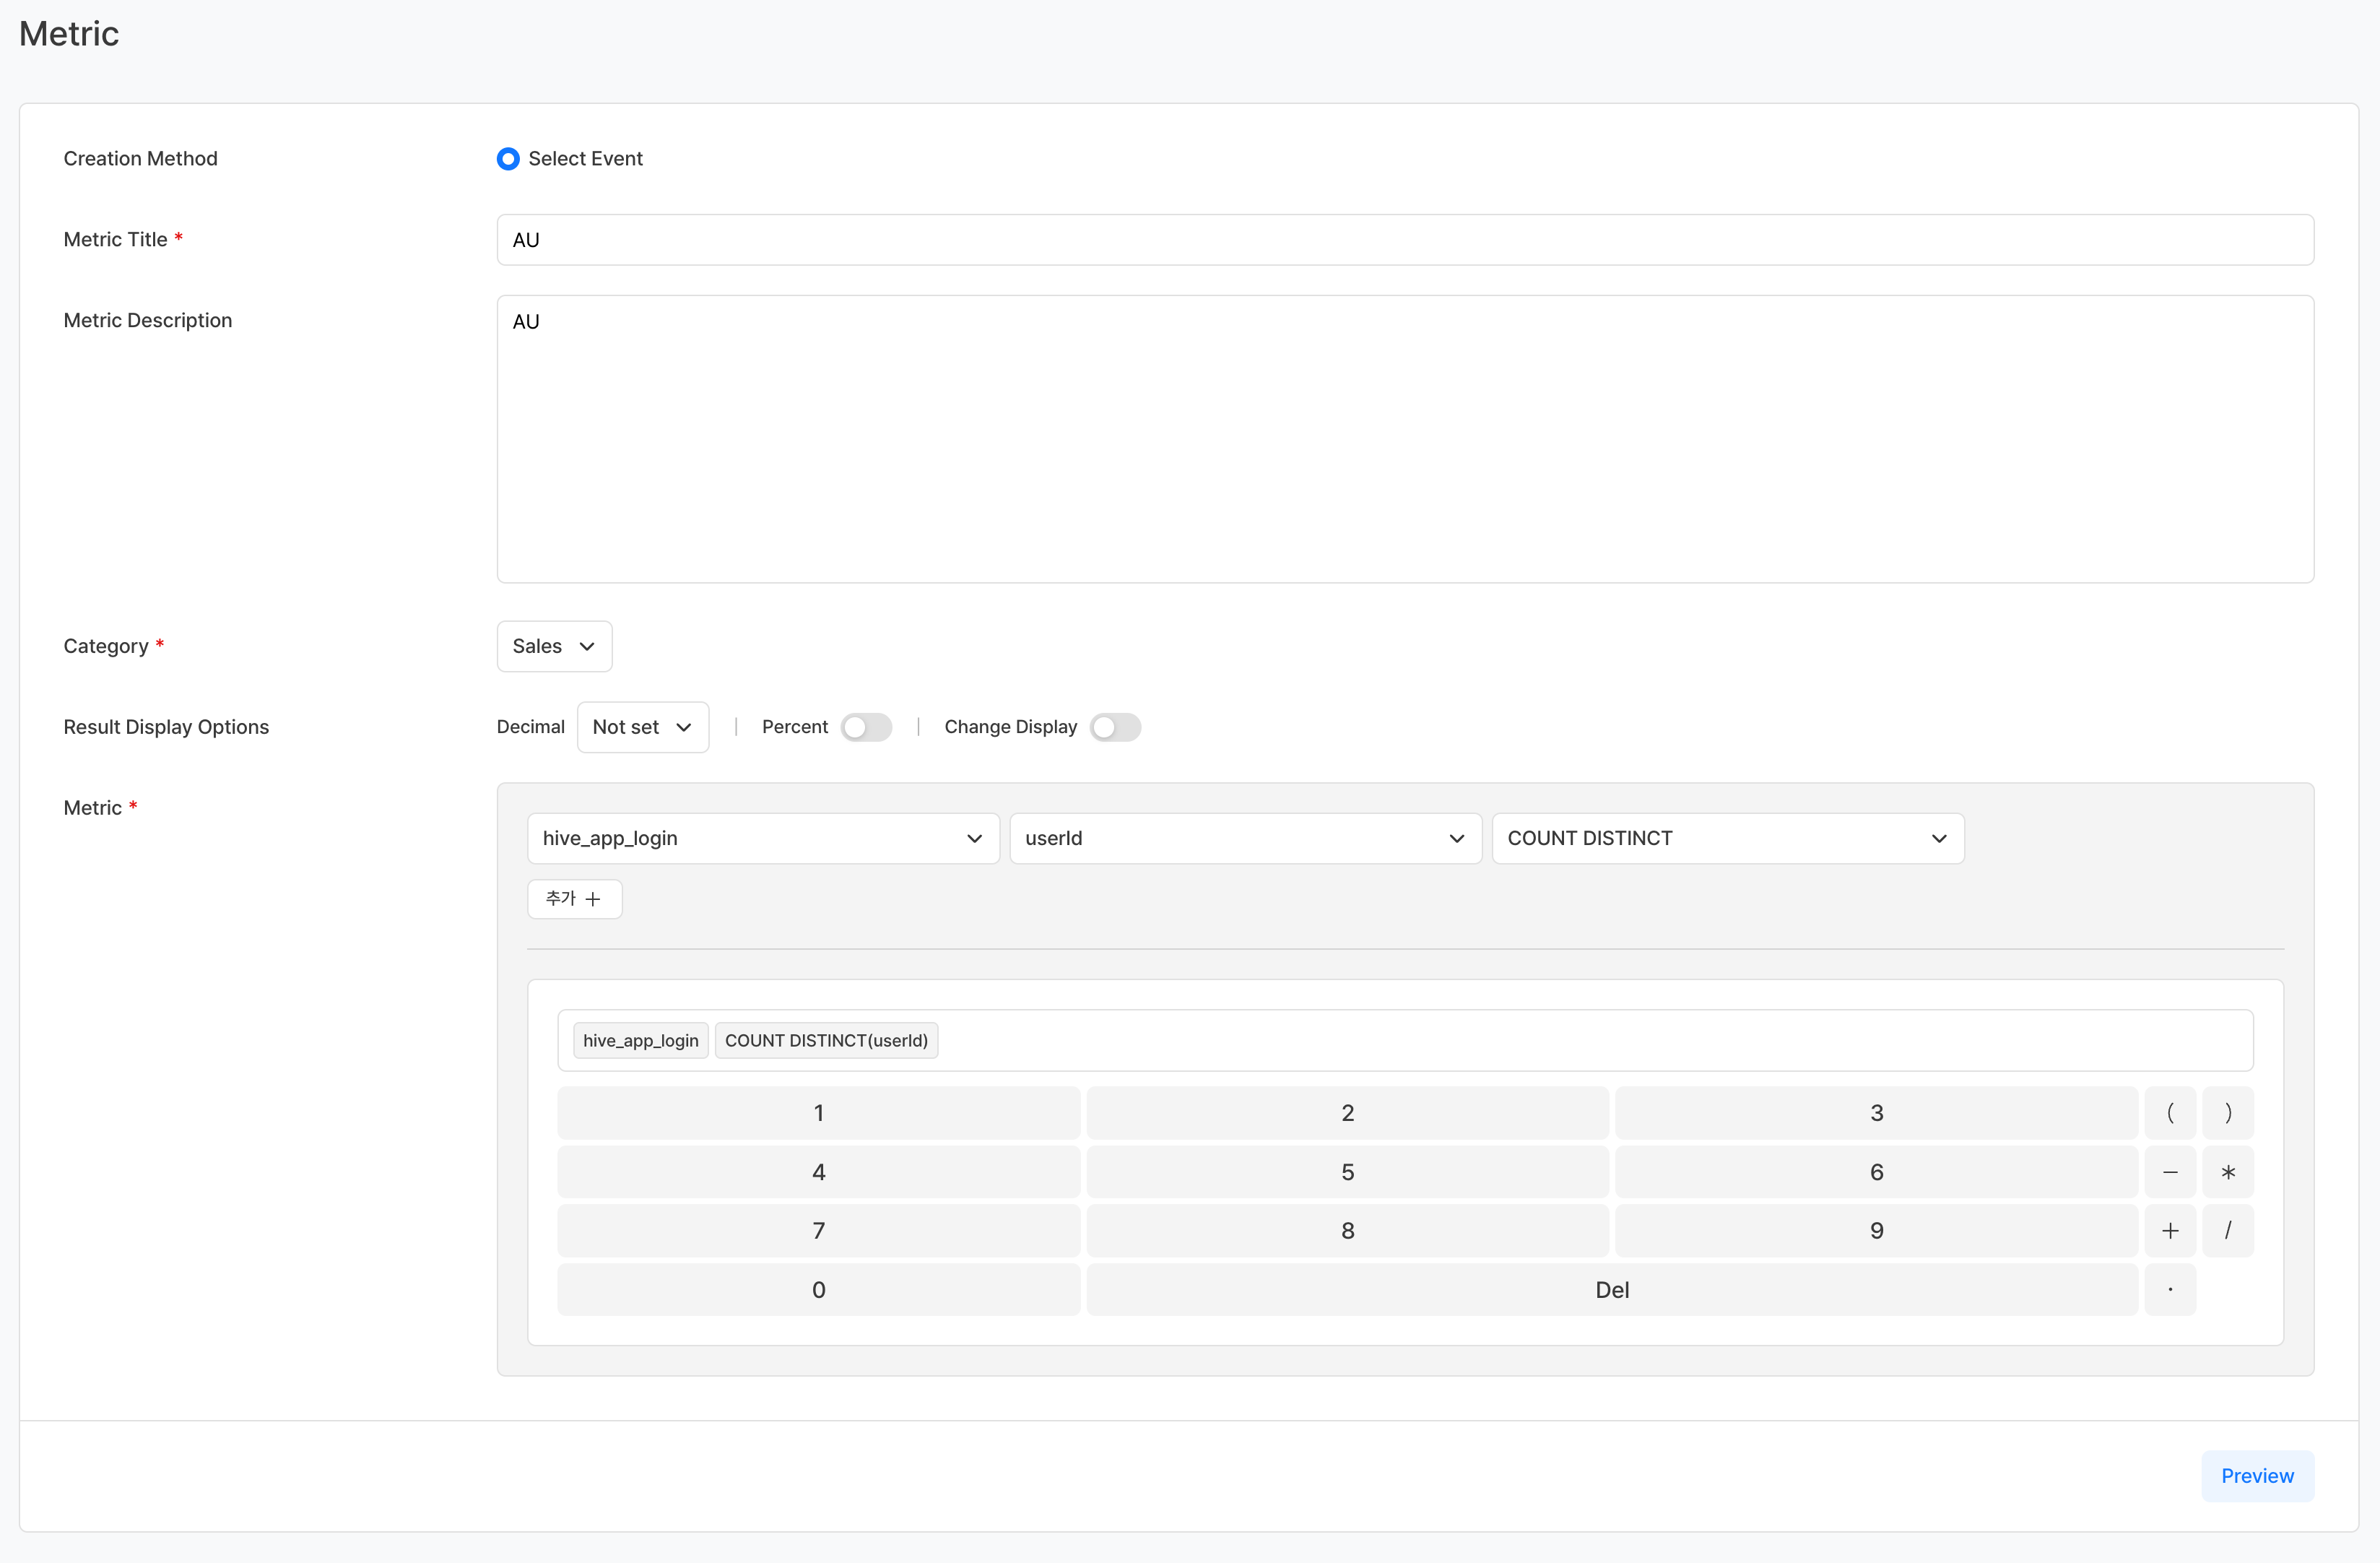
Basic information
| Item | Required | Description |
|---|---|---|
| Metric Title | Required | Name displayed on analysis screen (maximum 30 characters) |
| Metric Description | Select | Description of metric calculation method and purpose (maximum 300 characters) |
| Category | Required | Select a metric classification category created within an existing company, or create a new one by entering it directly |
| Result display options | Select | Decimal places / percent notation / increase/decrease display settings |
| Metrics | Required | Formula composition with event selection + value selection + operation selection. You can create complex formulas by combining multiple items with the Add button |
Metric settings
Metrics are defined as a combination of events, attribute values, and attribute aggregation methods.
| Aggregation method | Description | Main uses |
|---|---|---|
| COUNT | Total number of event occurrences | Event Occurrence Frequency |
| COUNT DISTINCT | Number of unique users/values excluding duplicates | Number of connected users, number of paying users |
| SUM | Sum of attribute values | Total Sales, Total Play Time |
| AVG | Average of attribute values | Average payment amount, average play time |
| MIN | Minimum value of attribute value | Minimum payment amount |
| MAX | Maximum value of attribute value | Highest achieved level |
| MAX BY | Most recent (last) attribute value | Last level |
Metric Definition Example
| Metric Title | Formula (Event · Aggregation · Attribute · Filter) |
|---|---|
| AU | app_login · COUNT DISTINCT · userId |
| In-app sales | product_purchase · SUM · price |
| Number of sales | product_purchase · COUNT DISTINCT · transactionId |
| PU RATE(%) | ( (product_purchase · COUNT DISTINCT · userId) * 100 ) / ( app_login · COUNT DISTINCT · userId ) |
A complex formula that combines the aggregated results of two events, such as PU and RATE(%), can also be defined as a single metric.
Tip
Metrics only define “what to count,” and charts determine “what to look at.” For example, if you want to check the DAU/WAU/MAU indicator, you only need to define AU. After defining one AU metric, if you change the period unit on the chart to daily/weekly/monthly, it will automatically become DAU·WAU·MAU.
Metric Category Management
Create and manage categories to classify metrics by purpose. If you don't see the category you want, you can click 'Direct Entry' to enter it using the keyboard. 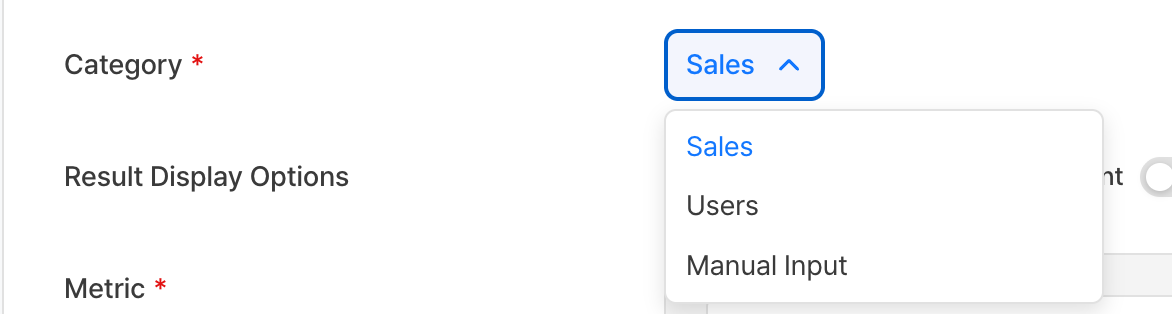
Category Example
- User indicators (DAU, MAU, WAU)
- Sales indicators (ARPU, ARPPU, in-app sales)
- Session metrics (number of sessions, play time, average number of sessions)
- Game play indicators (number of content plays, amount of goods acquired, amount of goods consumed)
Controlling the display of metrics

- If the metric type is not 'Platform', you can set whether or not to expose each metric by toggling Enabled or not in the list.
- Setting OFF to Create > will hide that metric from the chart's measure selection list.
Copy and delete metrics
- Copy: Quickly create similar metrics based on existing metrics
- Delete: Delete metrics that are no longer in use.
Warning
If you have charts/dashboards that are using a metric that has been deleted, data from that content may not be displayed.
Using metrics in charts
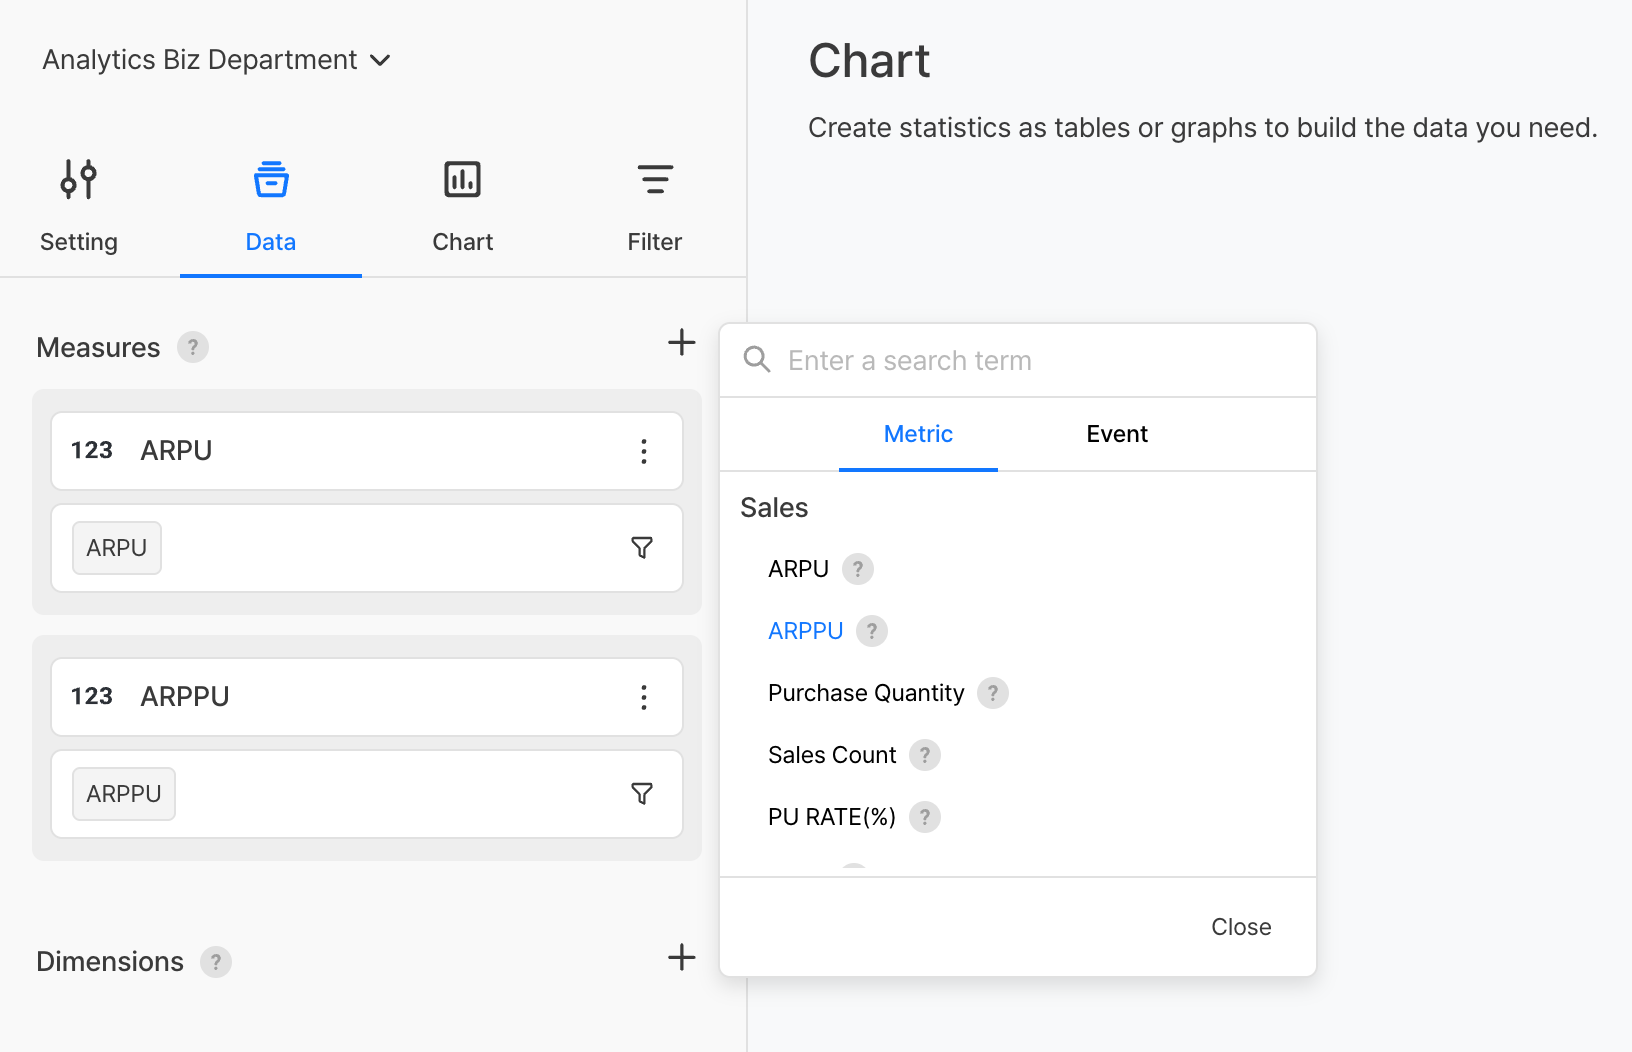
- Move to the [Data] tab on the Create > chart creation screen.
- Click the
+button on the right side of the measurement value area. - Search for and select the metric you created.
Precautions & Tips
- Built-in metrics are provided by default by the system and cannot be modified or deleted.
- Before deleting a metric, first check which charts/dashboards are using the metric.
- Changing a metric formula immediately changes the data in all charts that use that metric. Edit important metrics carefully.
- For common metrics used by the entire team, write detailed descriptions and clearly share definitions and calculation methods.
- Check existing metrics by searching before creating them to avoid creating duplicate metrics with similar names.