Overview
Overview
Analytics is a big data analysis service that tracks key indicators such as DAU, sales, and retention based on event data, and helps maximize marketing efficiency through segment-based indicator analysis and targeting.
Data flow
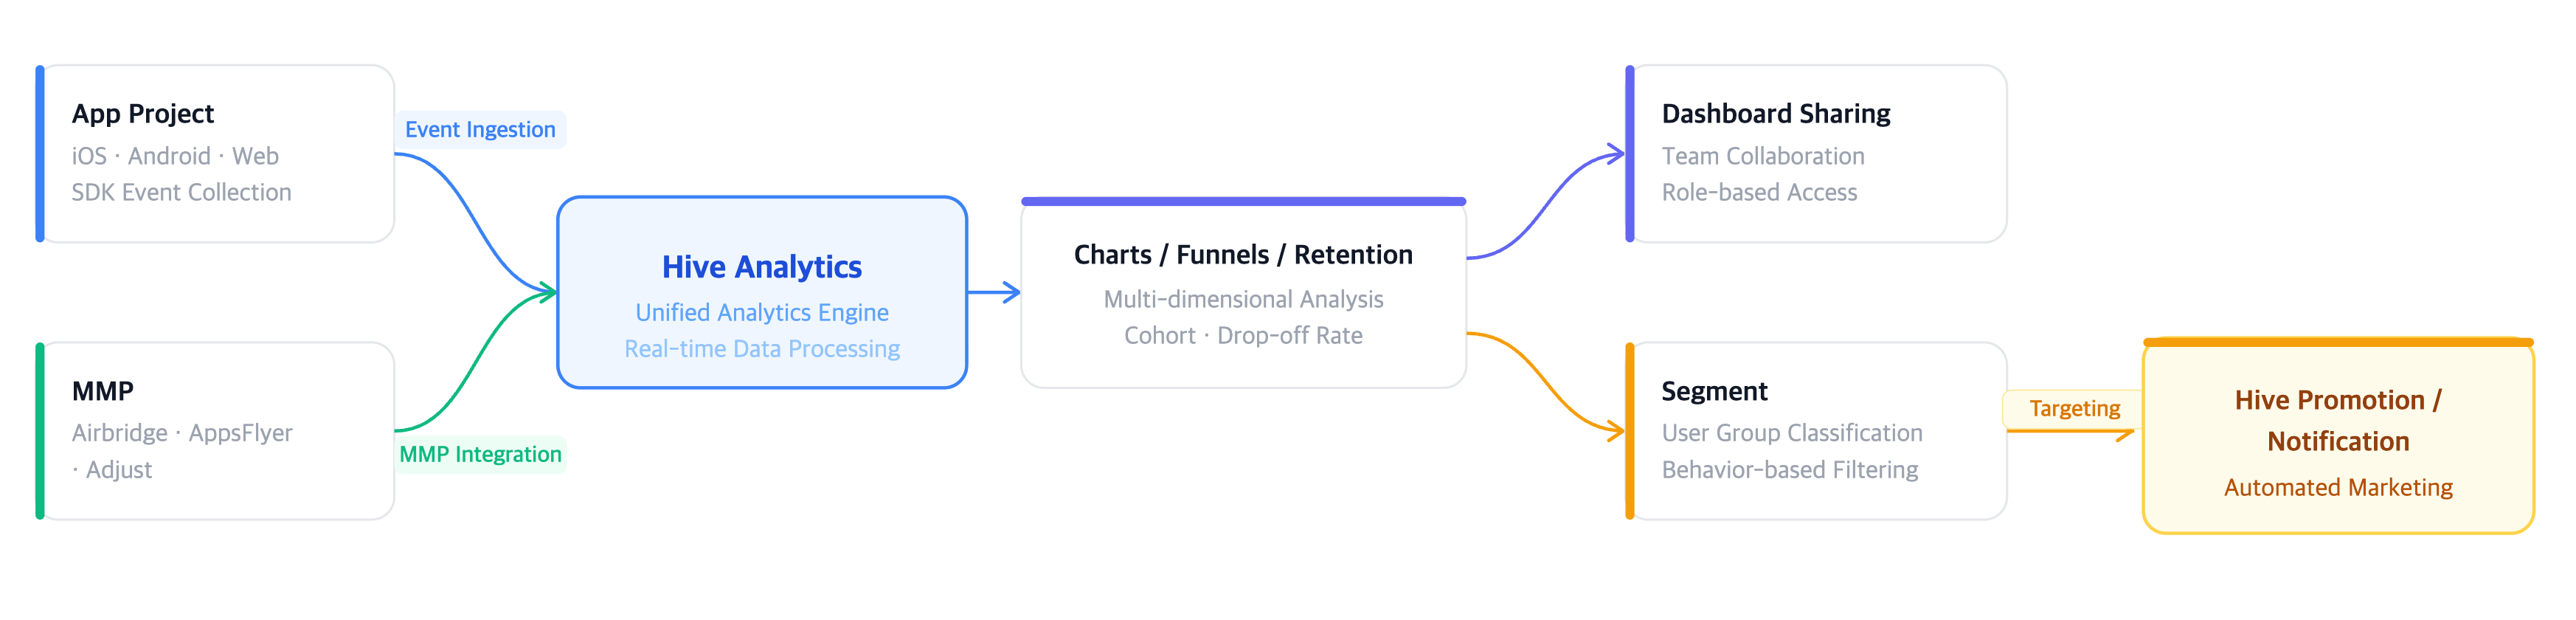
Main Features
- Analysis possible without code: You can immediately configure charts and dashboards without SQL or a separate script, just by selecting events/metrics in the UI.
- Event-based analysis possible: If event data is sent in an unstructured form, it can be sent directly to Analytics and used for analysis without defining logs in advance.
- Unlimited data storage capacity: All event data sent to Analytics can be collected without any storage limit.
- Segment and Targeting – You can group users by combining the desired attribute conditions and immediately conduct a targeting campaign in conjunction with Hive promotion/notification products.
- Central management of indicators: If you save frequently used aggregation settings as metric, they can be reflected in all connected charts and dashboards when the standards change.
Getting started
If this is your first time using Analytics, follow these steps to prepare your environment.
- Console Sign-up: Sign up for the Hive analytics console.
- appId Registration: Register Hive game and appId in App Center.
- Analytics Management, Organization Management: Set the administrator and organization environment.
Common Concept Terminology
| Terminology | Description |
| Workspace | Unit space where content (charts, funnel, retention, dashboard) is stored |
| Project | Games subject to analysis |
| Event | Basic unit of user activity tracking (e.g. login, purchase, level up) |
| Metrics | Stored metrics based on events (e.g. DAU, ARPU) |
| Dimension | Attributes to group/filter data (e.g. country, OS, app version) |
| Segment | User group defined by combining conditions |
| MMP | Mobile Measurement Partner (Airbridge, AppsFlyer, Adjust, etc.) |
| Identifier | Standard value to classify users (userId or deviceId) |
Getting started guide by role
If you're new to Analytics, start in the order appropriate for your role below.
Business/Marketing Manager
This is a starting order for those in charge of analyzing game indicators, measuring content performance, and extracting target users.
| order | document | Purpose |
| 1 | Workspace Management | Create a dedicated analytics space and set team permissions |
| 2 | Home | Check the status of key KPI set in the workspace |
| 3 | funnel | Analyzing sections with high dropout rates and deriving points for improvement |
| 4 | Retention | Checking initial immersion and long-term box office potential through return visit rate |
| 5 | Chart | Analyze custom indicators by combining desired data conditions |
| 6 | dashboard | Organize key analysis results on one screen and share them with your team |
| 7 | segment | Condition-based target user extraction and campaign utilization |
| 8 | Move user category | Monitoring whale user withdrawal and establishing strategies to secure genuine users |
| 9 | User Activity Tracking | Check individual user behavior and respond to abuse/inquiries |
Data Analyst
This is a starting point for those responsible for everything from understanding the status of events being collected to doing deeper analysis and defining cohorts.
| order | document | Purpose |
| 1 | Event | Identify the overall status of events and attributes being collected and verify data quality |
| 2 | metric | Team common KPI indicator definition |
| 3 | funnel | Analyzing sections with high dropout rates and deriving points for improvement |
| 4 | Retention | Checking initial immersion and long-term box office potential through return visit rate |
| 5 | Chart | Analyze custom indicators by combining desired data conditions |
| 6 | segment | Cohort definition and target user classification |
| 7 | User Classification | Identify the proportion of users by type and the current status of whale users |
| 8 | User Activity Tracking | In-depth analysis of individual user behavior |
Developer
This is the starting order for developers responsible for setting up data environments, linking events, and managing third-party tools.
Data Transfer
Analytics automatically collects some events through Hive SDK. Events that are not automatically collected or that are additionally required by the game can be sent separately.
| document | Description |
| Event transmission | Transmit event logs required for analysis from client or server |
| MMP linking | Send MMP event by linking MMP |
| Event template | Check event structure and whether SDK is automatically collected by event |
All Features
Main menu
| document | Description |
| Home | Check dashboard by workspace |
| All Content | View and manage entire content list |
Create
| document | Description |
| Chart | Event/metric-based data visualization |
| funnel | Step-by-step conversion/churn analysis |
| Retention | User revisit/retention rate analysis |
| dashboard | Content Integration Dashboard |
| template | Saving and utilizing chart templates |
User
Data
| document | Description |
| Event | Event and attribute definition/management |
| metric | Common indicator definition/management |
| Linked | Third party integration such as MMP |
| Export data | Event data cloud storage upload |
Setting
The indicator settings submenu is exposed to all users and the list can be viewed. However, registration/deletion/modification is only possible with Analytics Manager.
| Menu | View | Register/Delete/Modify |
| Metric Excluded User Management | All users | Analytics Manager |
| Metric Filter Management | All users | Analytics Manager |
| Currency Settings | All users | Analytics Manager |
| Time settings | All users | Analytics Manager |