Ranking
Overview
Ranking is a feature that ranks targets based on a selected measure value and displays the dimension values together in the result.
What Can You Do?
Business/Marketing Users
- Find VIP targets with the revenue ranking by user, and review customized benefits or operation policies.
- Identify the products purchased most with the revenue count ranking by product, and decide which products to check first.
Data Analysts
- Add dimension values such as market or country to break down the ranking by criterion, and identify the targets that contributed most to revenue for each criterion.
- Check the top targets first, then review them together with country, market, and user characteristics to quickly narrow the scope of follow-up analysis.
Developers
- Set an event attribute as a dimension value to check the aggregation results by attribute value as a ranking, and review the distribution of the collected values.
Quick Start
If you are creating a ranking for the first time, follow these steps to create your first ranking.
- Click the Create button at the top and select Ranking.
- At the top, select the workspace to save the ranking in.
- On the [Settings] tab, set the project to analyze and the date range.
- On the [Data] tab, add at least one measure value and one dimension value.
- Select the ranks to show (Top N), the sort order, and the tie handling method.
- Check the ranking in the preview area on the right.
- Click the Save button at the bottom and enter the ranking information.
Note
For detailed settings such as the ranking method, tie handling, and chart type, see All Features.
All Features
Key Concepts
| Concept | Description |
|---|---|
| Measure Value | The figure used as the basis for ranking. Example: revenue, revenue count |
| Dimension Value | The target to rank. Example: user identifier (userId), product name |
| Period | The period for calculating the ranking (the entire selected period is aggregated as one) |
| Ranks to Show (Top N) | The range of ranks to show in the result (up to 500) |
| Ranking Method | How to rank when there are two or more dimension values: across all data or separately per dimension |
| Tie Handling | How to assign ranks to targets with the same measure value |
[Settings] Tab
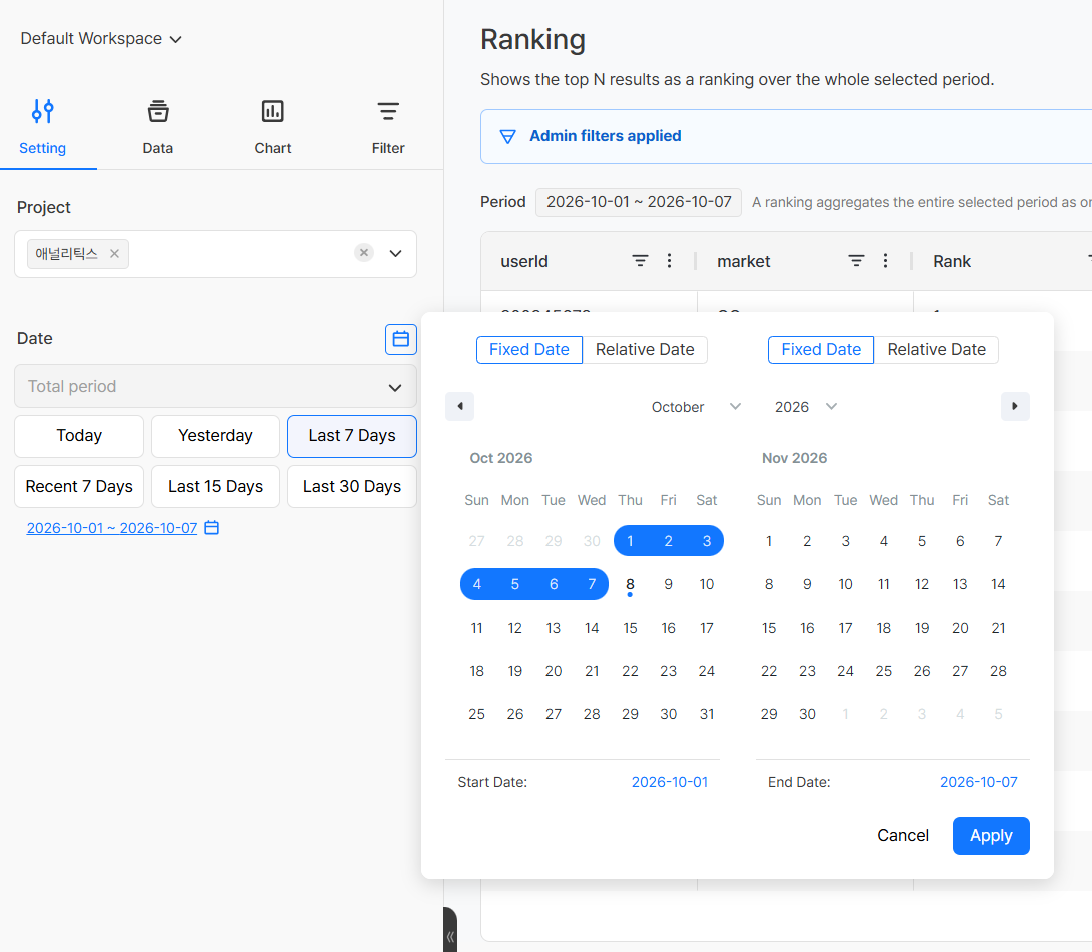
Enter the basic information of the ranking.
| Item | Required | Description |
|---|---|---|
| Project | Required | Select the game to analyze |
| Date Range | Required | Select the start and end dates for calculating the ranking |
When you select a date range, you can use the quick select buttons or select dates directly with the calendar button.
The Recent and Last quick select buttons use different reference dates.
| Type | Reference date | Example |
|---|---|---|
| Recent N days | Calculated based on today | Recent 7 days -> 7 days including today |
| Last N days | Calculated based on yesterday | Last 7 days -> 7 days including yesterday |
Note
A ranking is not split into period units such as daily or weekly. The entire selected date range is aggregated as one to calculate the ranking.
[Data] Tab
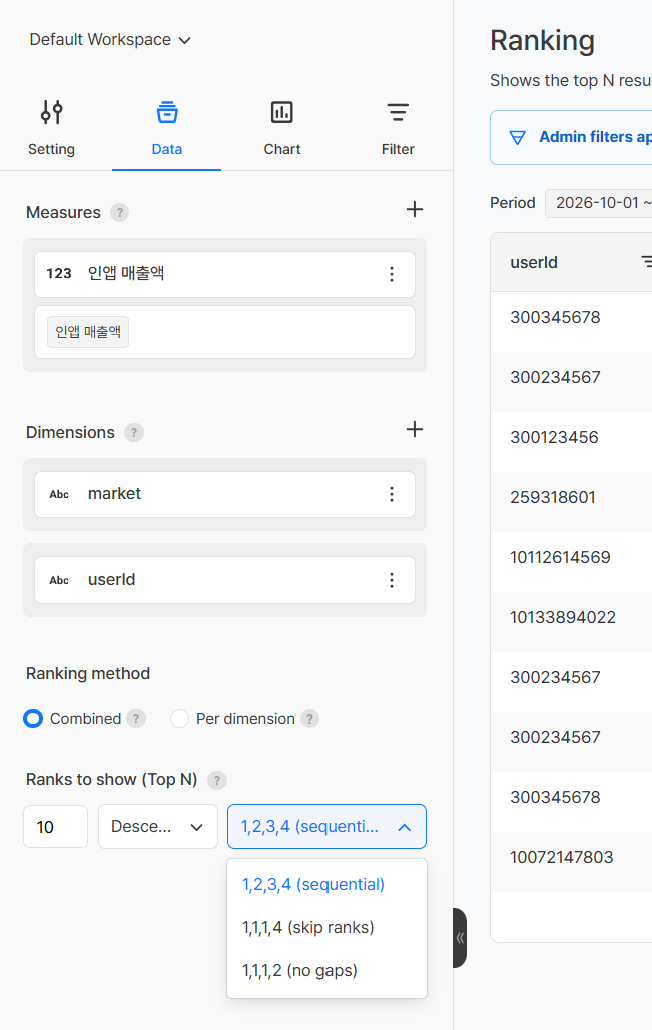
Set the measure value that the ranking is based on, the dimension values to rank, and how ranks are shown.
Measure Value Settings
Click the + button to the right of Measures and select the event or metric to use as the basis for the ranking. Example: revenue, revenue count
Set Dimension Value
Click the + button to the right of Dimensions and select the target to rank. You must select at least one dimension value.
- Example: revenue ranking by user -> set the user identifier (
userId) as the dimension - Example: revenue count ranking by product -> set the product name (
productName) as the dimension
Ranking Method
If you select two or more dimension values, you can select the ranking method.
| Method | Description |
|---|---|
| Combined | Ranking calculated based on all data, regardless of dimension |
| Per dimension | Ranking of the last dimension value calculated separately for each combination of the preceding dimension values |
Example
If you add the dimension values in the order market -> userId and select Per dimension, you can check the revenue ranking by user separately for each market.
Ranks to Show (Top N)
Set the range of ranks to show in the result and the sort order.
| Item | Description |
|---|---|
| Ranks to Show | Number of ranks to show in the result (up to 500) |
| Sort Order | Descending or ascending (descending to see the targets with the largest measure value first) |
Tie Handling
Select how to assign ranks to targets with the same measure value.
| Method | Display example | Description |
|---|---|---|
| Sequential | 1, 2, 3, 4 | Different ranks assigned in order even for ties |
| Skip ranks | 1, 1, 1, 4 | Same rank assigned to ties, and the next rank skipped by the number of ties |
| No gaps | 1, 1, 1, 2 | Same rank assigned to ties, and the next rank assigned without skipping |
[Filter] Tab
Set filter conditions that apply to all measure values added to the ranking.
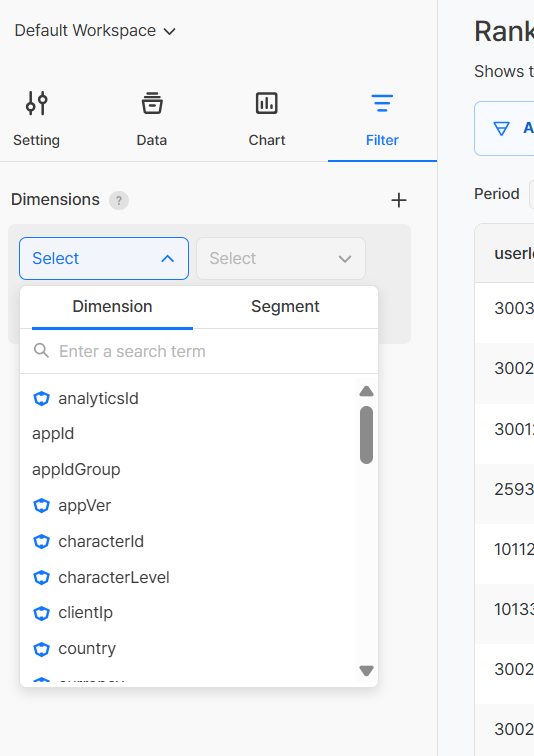
Select the filter target from Dimension and Segment.
Note
The items shown in the filter's dimension are the attributes of all events used to create the measure values. If a specific event does not have the attribute, the filter does not apply to that event.
Filter Condition Operators
| Operator | Description |
|---|---|
| Equals | Only data that exactly matches the entered value (example: view only users whose country is "Korea" or "Japan") |
| Not Equals | Only data that does not match the entered value (example: view only users whose OS is not "Android" or "PC") |
| Less Than or Equal | Data less than or equal to the entered value (example: view only cases where the payment amount is 10,000 KRW or less) |
| Greater Than or Equal | Data greater than or equal to the entered value (example: view only users whose level is 50 or higher) |
| Range | Data between the two entered values (example: view only cases where the payment amount is from 1,000 KRW to 10,000 KRW) |
| No Value | Data where no value is recorded for the attribute (example: view only users without country information) |
| Has Value | Data where at least one value is recorded for the attribute (example: view only users with country information) |
Note
The Greater Than or Equal, Less Than or Equal, and Range operators are not shown when the attribute's data type is text.
- You can combine multiple filter conditions with the AND / OR operators.
- AND: Includes only data that meets both conditions. Example: a filter for data where the country is "Korea" and the payment amount is 10,000 KRW or more
- OR: Includes data that meets at least one of the two conditions. Example: a filter for data where the country is "Korea" or the country is "Japan"
Segment Filter
If you select a segment as a filter, only the data of users in that segment is reflected in the ranking. Depending on how you combine the segment conditions, you can use it in two ways: Dynamic Cohort and Static Cohort.
| Method | Condition combination | Meaning |
|---|---|---|
| Dynamic Cohort | Select a segment only | Users matching the current conditions, recalculated every time the ranking is viewed (the ranking result changes when users enter or leave the segment conditions) |
| Static Cohort | Select a segment and a segment snapshot together | User list fixed at the point in time when the segment snapshot was created (the set of users stays the same even if user status changes later) |
Tip
- To see the users who meet the conditions right now in real time -> Dynamic Cohort (select a segment only)
- To fix and analyze the users as of a specific point in time, such as a campaign start date -> Static Cohort (select a segment + snapshot)
For how to create segments and segment snapshots, see the Segment document.
[Chart] Tab
Set the visualization method for displaying the data.
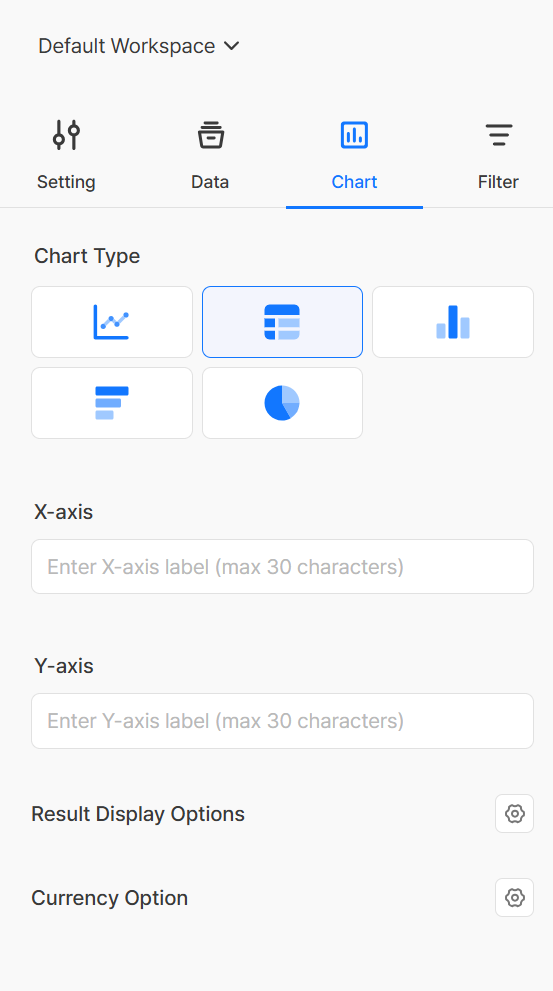
Chart Type
| Type | Main purpose |
|---|---|
| Line Chart | Changes in figures shown as a line |
| Vertical Bar Chart | Figures by item compared with vertical bars |
| Horizontal Bar Chart | Figures by item compared with horizontal bars |
| Pie Chart | Proportion of the top targets shown as a circle |
| Table | Ranks, dimension values, and measure values shown in table form |
Visualization Details
| Item | Description |
|---|---|
| X-axis Name | Label text displayed on the X-axis |
| Y-axis Name | Label text displayed on the Y-axis |
| Currency Option | Currency unit to convert and display figures in (shown only when an attribute specified as a 'Money Attribute' in Data > Event is used in a measure value) |
| Result Display Options | How the figures are displayed (the decimal, change display, and percent options can be combined) |
Result Display Options Details
| Option | Description |
|---|---|
| Decimal | Number of decimal places to display (example: 2 decimal places -> 1,234.56) |
| Change Display | Red (▲) for positive figures, blue (▼) for negative figures |
| Percent | % sign added to the figure (example: 13 -> 13%) |
Edit Ranking
- In All Content, click the title of the ranking to edit to go to the edit page.
- Change the settings on the tab you want.
- Click the Save button at the bottom.
Notes & Tips
- A ranking aggregates the entire selected period as one. To see trends over time, use a Chart.
- You can show up to 500 ranks.
- You can select the ranking method only when you select two or more dimension values.
- With the Per dimension method, the order of the dimension values affects the result. Add the target to rank as the last dimension value.