User classification metrics
Overview
Based on users' in-app activity and purchase-related data, this feature automatically distinguishes activity strength and purchase strength with the K-Means clustering technique and defines user classification types based on them. Values are provided using the last access date of users who accessed during the selected period as the reference date.
- These metrics are updated every day at 7:00 AM Korea Standard Time (KST).
- You can check them just by integrating the SDK, without sending separate logs.
What can you do?
Business/marketing users
- You can quickly define target groups by understanding the size and ratio of each user classification type, such as whale, dolphin, and non-paying.
- When you click a cell of the type you want, you can immediately create a segment and connect it to a targeting campaign.
- You can check the distribution of users by country and OS to establish strategies that fit regional and platform characteristics.
Data analysts
- With the activity strength/purchase strength classification table and the characteristic distribution by type, you can analyze the behavior patterns of user groups from multiple angles.
- By changing the period and comparing the trends in the number and ratio of users by user classification type, you can identify the causes of changes in app metrics.
Quick start
- In the left menu, click User > User Classification.
- Set the Project and Period for which you want to check the metrics.
- In the User Classification Type table, check the number of users by activity strength/purchase strength and the ratio by type.
Full features
Key concepts
| Concept | Description |
|---|---|
| Reference Date | The last access date of users who accessed during the selected period |
| Activity Strength | The user's engagement with the app, measured based on access and play data for the 3 days up to and including the reference date. Divided into four levels: high / medium / low / new |
| Purchase Strength | The user's payment tendency, measured based on cumulative purchase data from the first access date to the reference date. Divided into four levels: high / medium / low / non-paying |
| User Classification Type | Six user types defined by combining activity strength and purchase strength |
Metric terms
Activity strength
A user's activity strength is measured based on data for the 3 days up to and including the reference date, using the user's access date as the reference date.
Example
Example: A user who accessed on January 10 → measured using data from January 8 to January 10 (3 days)
Activity strength consists of four levels (high, medium, low, and new), and the measured items are as follows. However, if activity strength is new, the user is a new user on the reference date itself, regardless of the measured items below.
- Number of logins in the 3 days up to and including the reference date
- Number of login days in the 3 days up to and including the reference date
- Daily average number of logins in the 3 days up to and including the reference date (number of logins / number of login days)
- Total app usage time in the 3 days up to and including the reference date (seconds)
- Average app usage time for each hour from 00:00 to 23:00 in the 3 days up to and including the reference date (seconds)
- Number of rewarded ad views in the 3 days up to and including the reference date
- Whether a push was opened in the 3 days up to and including the reference date
Purchase strength
A user's purchase strength is measured based on cumulative data for the entire period from the user's first access date to the reference date, using the user's access date as the reference date.
Example
Example: If the first access date of a user who accessed on January 10 is January 1 → measured using data from January 1 to January 10
Purchase strength consists of four levels (high, medium, low, and non-paying), and the measured items are as follows. However, if purchase strength is non-paying, the user has no purchase history from the first access date through the reference date, regardless of the measured items below.
- Time from the user's first login to the first purchase (unit: days)
- Total number of payments by the user from the first login to the reference date
- Average payment amount per payment from the user's first login to the reference date (total payment amount of the user / total number of payments of the user)
User classification type
User classification types are defined based on activity strength and purchase strength, and if the criteria overlap, the user is classified into the higher type.
| Type | Classification criteria |
|---|---|
| Whale User | Both activity strength and purchase strength are "high" |
| Dolphin User | Either activity strength or purchase strength is "high" |
| Middle User | Either activity strength or purchase strength is "medium" |
| Light User | Both activity strength and purchase strength are "low" |
| Non-Paying User | Purchase strength is "non-paying" regardless of activity strength |
| New User | Activity strength is "new" regardless of purchase strength |
Metric details
Metric values are provided using the last access date of users who accessed during the selected period as the reference date.
Example
Example: If you select January 1 to January 10 as the period, a user who accessed on January 1, 3, 5, and 10 is based on January 10, and a user who accessed only on January 1 is based on January 1.
User classification type
In User Classification Type, you can check the number and ratio of users by activity strength/purchase strength in the left table, and the number and ratio of users by user classification type in the right table.
User count and ratio by activity strength/purchase strength 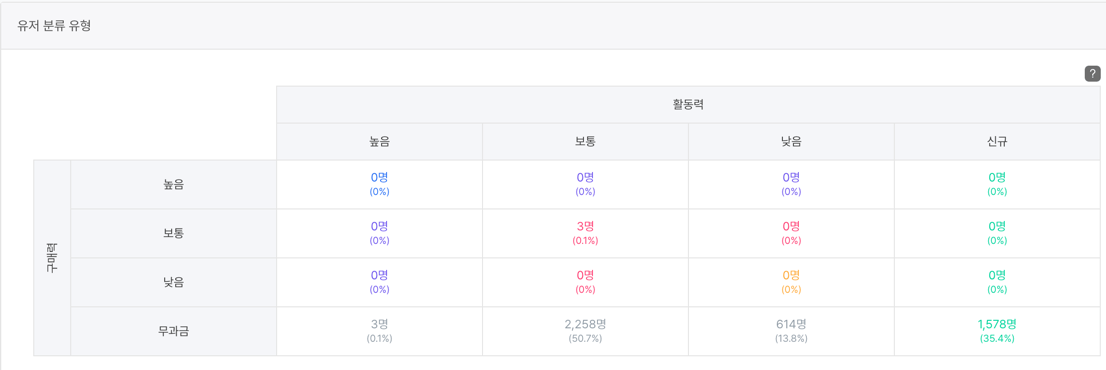
- You can check the number of users and the composition ratio by activity strength/purchase strength classification.
- When you click a cell in this table, you can create a segment of the users with the clicked activity strength/purchase strength.
User count and ratio by user classification type 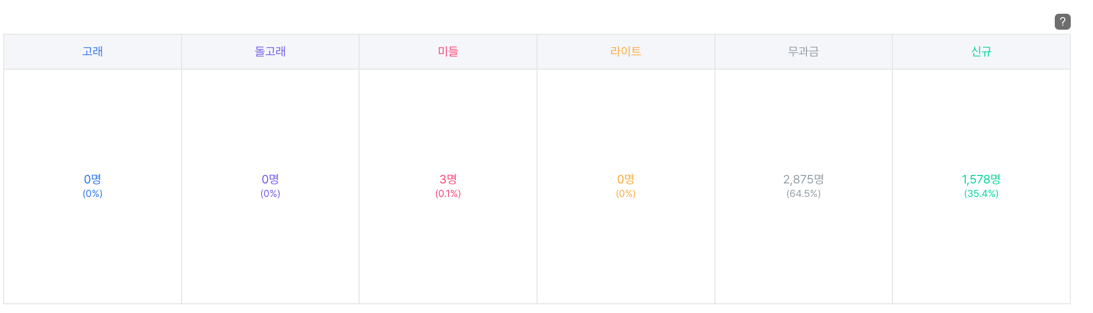
- You can check the number and ratio of users by user classification type.
- When you click a type name or a cell in this table, you can create a segment of the users of the classification type you want to target.
- The ratios of the user classification types in the table add up to 100%, so if you click all classification types, you can target all users in the selected period.
Characteristic distribution by user classification type
You can check the distribution of the characteristic values of each user classification type. 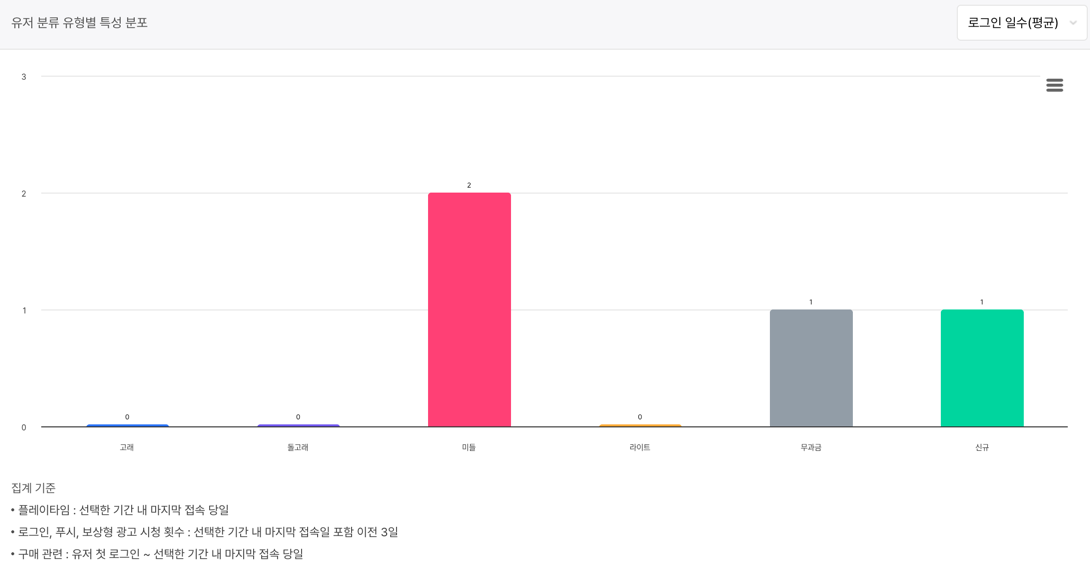
| Characteristic | Description |
|---|---|
| Playtime (min/avg) | The average playtime on the last access day within the selected period for each user classification type, converted to minutes. |
| Login Days (avg) | The average number of login days in the 3 days up to and including the last access within the selected period for each user classification type. |
| Login Count (avg) | The average number of logins in the 3 days up to and including the last access within the selected period for each user classification type. |
| Daily Average Login Count | The average of the values calculated as login days / login count for each user classification type. |
| Push Response Rate (avg) | The rate at which pushes were opened in the 3 days up to and including the last access within the selected period for each user classification type. |
| Rewarded Ad Views (avg) | The number of times rewarded ads were viewed in the 3 days up to and including the last access within the selected period for each user classification type. |
| Days to First Purchase (avg) | The average number of days from the user's first access to the first purchase for each user classification type. |
| Cumulative Payment Amount | The sum of the payment amounts from the user's first access to the last access within the selected period for each user classification type. |
| Payment Amount per User | The payment amount per user (cumulative payment amount / number of paying users) among users who purchased at least once from the user's first access to the last access within the selected period, for each user classification type. |
OS distribution by user classification type
You can check the percentage that a specific OS accounts for in each user classification type. 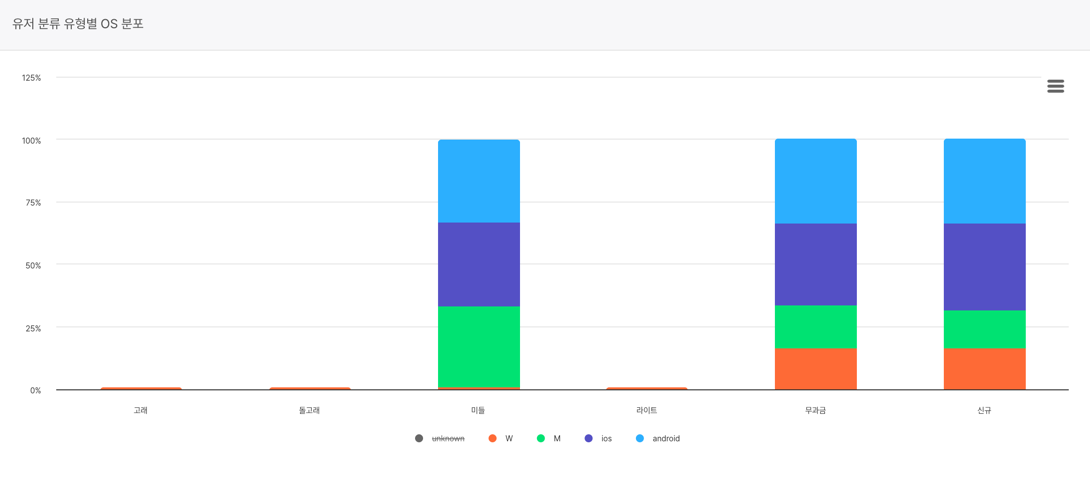
| Notation | OS |
|---|---|
| I | iOS |
| A | Android |
| W | Windows |
| M | Mac |
| P | PC |
| B | Alibaba Yun OS |
| T | Tizen |
Note
If the OS is unknown, either the OS value was not received in the Hive login log, or no users belong to that user classification type.
Top 10 countries by user classification type
When you hover the mouse over each graph, you can check the country code and ratio of each of the top 10 countries by user classification type, and the combined ratio of the values outside the top 10 countries as etc (others). 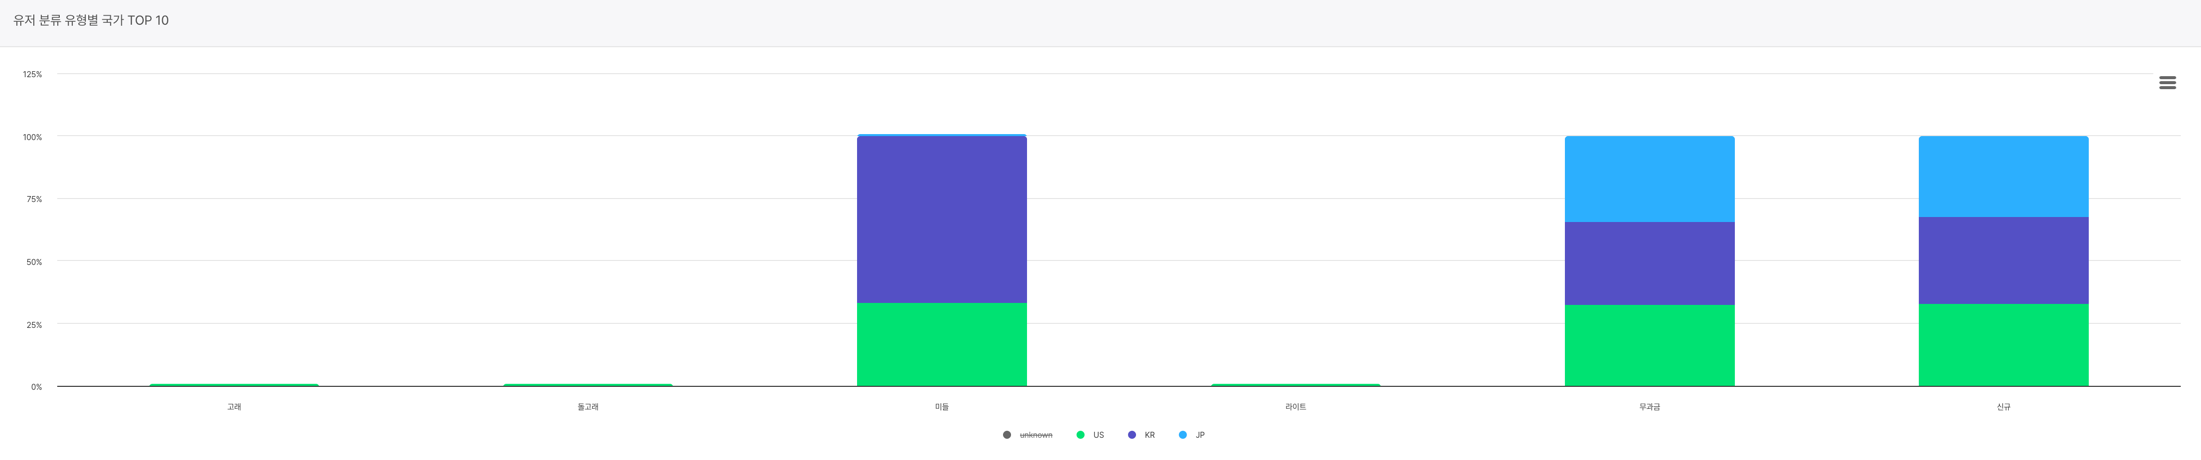
- Country codes follow ISO 3166-1 alpha-2 (2-byte country codes) and consist of two uppercase letters.
- If the country code is unknown, either the country value was not received in the Hive login log, or no users belong to that user classification type.
Create a segment
You can create a segment by clicking the user classification type legend or a cell in the user classification type table and then clicking the Create Segment button. 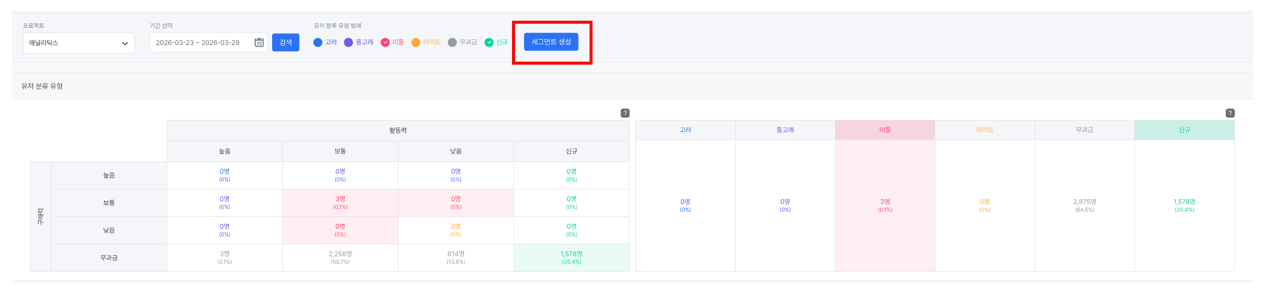 You can use the created segment as follows.
- Snapshot Download: You can download the characteristic data of the selected users as a CSV file with the Segment > Segment Snapshot > Download feature.
- Targeting Campaign: You can set up a targeting campaign for the selected users with the Segment > Targeting Campaign feature.
How to create
- Click one or more cells you want to target in the user classification type legend or the user classification type table.
- Click the Create Segment button, and when a pop-up appears, click the Confirm button.
- Click the Go to Segment Page button to go to the segment page.
Notes & tips
- Metric values are calculated based on each user's last access date within the selected period. The same user can be classified into a different type depending on the period.
- If the classification criteria overlap, the user is classified into the higher type. Example: high activity strength + medium purchase strength → dolphin user
- The metrics are updated every day at 7:00 AM (KST), so real-time data for the current day is not reflected.
- If you create a segment and use it together with User classification move metrics, you can analyze in depth how user types change.
Related menus
- User classification move metrics — Check the status of user classification type moves within the selected period
- Segment — Create segments based on user classification and use snapshots and targeting campaigns