Overview
Overview
Analytics is a big data analysis service that helps you track key metrics such as DAU, revenue, and retention based on event data, and maximize marketing efficiency with segment-based metric analysis and targeting.
Data flow
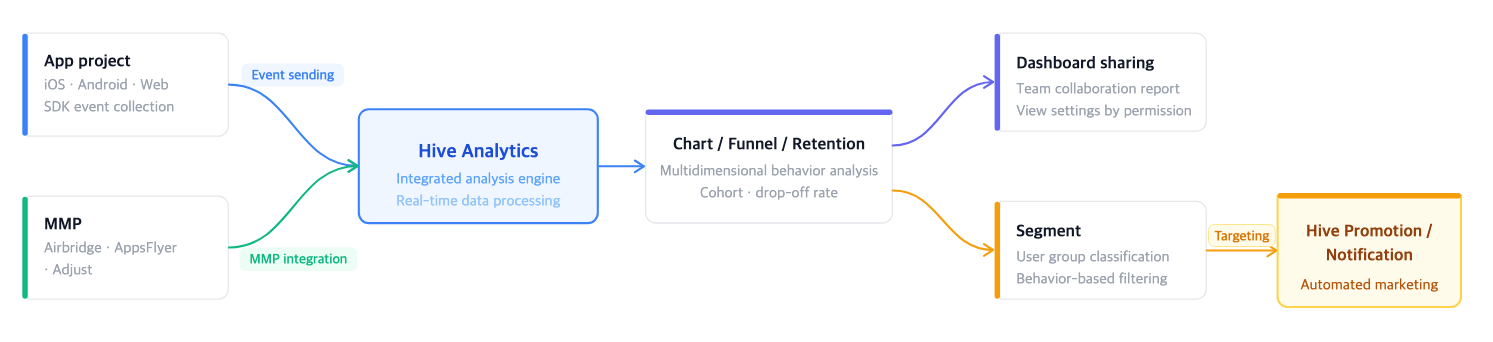
Key features
- Analysis without code: You can build charts and dashboards instantly just by selecting events and metrics in the UI, without SQL or separate scripts.
- Event-based analysis: When you send event data in an unstructured form, you can send it straight to Analytics and use it for analysis without defining logs in advance.
- Unlimited data storage capacity: You can collect all event data sent to Analytics without any capacity limit.
- Segments and targeting – You can group users by combining the attribute conditions you want and run targeting campaigns right away in conjunction with the Hive Promotion/Notification products.
- Central metric management: If you save frequently used aggregation settings as a Metric, you can apply criteria changes to all linked charts and dashboards at once.
Common concept terms
| Term | Description |
| Workspace | The unit space where content (charts, funnels, retention, dashboards) is stored |
| Project | The app to analyze |
| Event | The basic unit of user activity tracking (for example, login, purchase, and level-up) |
| Metric | A metric saved based on events (for example, DAU and ARPU) |
| Dimension | An attribute that groups or filters data (for example, country, OS, and app version) |
| Segment | A user group defined by combining conditions |
| Identifier | The reference value that distinguishes users (userId or deviceId) |
Getting started guide by role
If you are using Analytics for the first time, start in the order that fits your role below.
Business/marketing users
This is the starting order for those who handle everything from app metric analysis and content performance measurement to target user extraction.
| Order | Document | Purpose |
| 1 | Workspace management | Create a dedicated analysis space and set team permissions |
| 2 | Home | Understand the status of the key KPIs set in the workspace |
| 3 | Funnel | Analyze stages with high drop-off rates and find points for improvement |
| 4 | Retention | Check early engagement and long-term success potential with the revisit rate |
| 5 | Chart | Analyze custom metrics by combining the data conditions you want |
| 6 | Dashboard | Organize key analysis results on one screen and share them with the team |
| 7 | Segment | Extract condition-based target users and use them for campaigns |
| 8 | User classification move | Monitor whale user churn and build strategies to secure loyal users |
| 9 | User activity tracking | Check individual user behavior and handle abuse and inquiries |
Data analysts
This is the starting order for those who handle everything from understanding the status of the events being collected to in-depth analysis and cohort definition.
| Order | Document | Purpose |
| 1 | Event | Understand the overall status of the events and attributes being collected and verify data quality |
| 2 | Metric | Define common team KPI metrics |
| 3 | Funnel | Analyze stages with high drop-off rates and find points for improvement |
| 4 | Retention | Check early engagement and long-term success potential with the revisit rate |
| 5 | Chart | Analyze custom metrics by combining the data conditions you want |
| 6 | Segment | Define cohorts and classify target users |
| 7 | User classification | Understand the share of each user classification type and the status of whale users |
| 8 | User activity tracking | In-depth analysis of individual user behavior |
Developers
This is the starting order for developers who handle data environment setup, event integration, and third-party tool management.
Send data
Analytics automatically collects some events through the Hive Axyl SDK. You can separately send events that are not collected automatically or additional events that your app needs.
| Document | Description |
| Send events | Send the event logs needed for analysis from the client or server |
| Event template | Check the event structure and whether Hive Axyl automatically collects each event |
Full features
| Document | Description |
| Home | View dashboards by workspace |
| All content | View and manage the list of all content |
Create
| Document | Description |
| Chart | Data visualization based on events or metrics |
| Funnel | Analysis of conversion and drop-off by stage |
| Retention | Analysis of user revisit and retention rates |
| Dashboard | Integrated dashboard for content |
| Template | Save and use chart templates |
Users
Data
| Document | Description |
| Event | Define and manage events and attributes |
| Metric | Define and manage common metrics |
| Data export | Upload event data to cloud storage |
Settings
About permissions
The submenus of Metric Settings are visible to all users, and all users can view their lists. However, only Analytics administrators can register, delete, and edit.
| Menu | View | Register/Delete/Edit |
| Metric Excluded User Management | All users | Analytics administrators |
| Metric Filter Management | All users | Analytics administrators |
| Currency Settings | All users | Analytics administrators |
| Time Settings | All users | Analytics administrators |