Funnel
Overview
A funnel is a feature that analyzes conversion and drop-off at each stage based on the events collected by Analytics.
You can set the events that users perform in sequence as stages and check the conversion and drop-off rates of each stage to identify potential problem areas where users are likely to drop off.
What can you do?
Business/marketing users
- You can define the conversion flow from user acquisition to first payment as a funnel to identify the stage where the most users drop off.
- You can compare differences in conversion rates by region with a country filter to discover optimization opportunities for each region.
- You can set different periods before and after a campaign to compare changes in funnel conversion rates numerically.
Data analysts
- You can create multiple funnels to compare in depth the differences in conversion rates by user type (by country, by OS).
- You can combine stage filters and tracking periods to break down specific causes of drop-off.
- You can add funnel results to a dashboard to build a regular monitoring system.
Developers
- You can use funnels to verify that the connections between specific events are correct.
- After releasing a new feature, you can track the feature's events with a funnel to verify the conversion flow.
Quick start
If you are creating a funnel for the first time, follow the steps below to create your first funnel.
- Click the Create button at the top, and then select Funnel.
- At the top, select the workspace to save the funnel in.
- In the [Settings] tab, set the project and date range to analyze.
- In the [Section] tab, select events in order in the stage area. If needed, click the
+button on the right to add a stage. (At least two stages) - Select the identifier that user tracking is based on (account-based (userId) / device-based (deviceId)).
- Click the preview button to check the figures.
- Click the Save button at the bottom and enter the funnel information.
Note
For detailed settings such as stage filters, tracking periods, and visualization settings, see Full features.
Full features
Key concepts
| Concept | Description |
|---|---|
| Funnel Stage | The list of events that users must go through in order |
| Conversion Rate | The ratio of users who moved from the previous stage to the next stage |
| Drop-off Rate | The ratio of users who did not move from a specific stage to the next stage |
| Identifier | The user identification key (userId when account-based, deviceId when device-based) |
| Tracking Period | The period allowed for reference users to reach the funnel goal. It determines up to how many days after the start event to aggregate progress. |
| Reference Period | The unit period for extracting the users to analyze. The query period is divided into this unit for comparison by interval. |
[Settings] tab
Enter the basic information of the funnel. 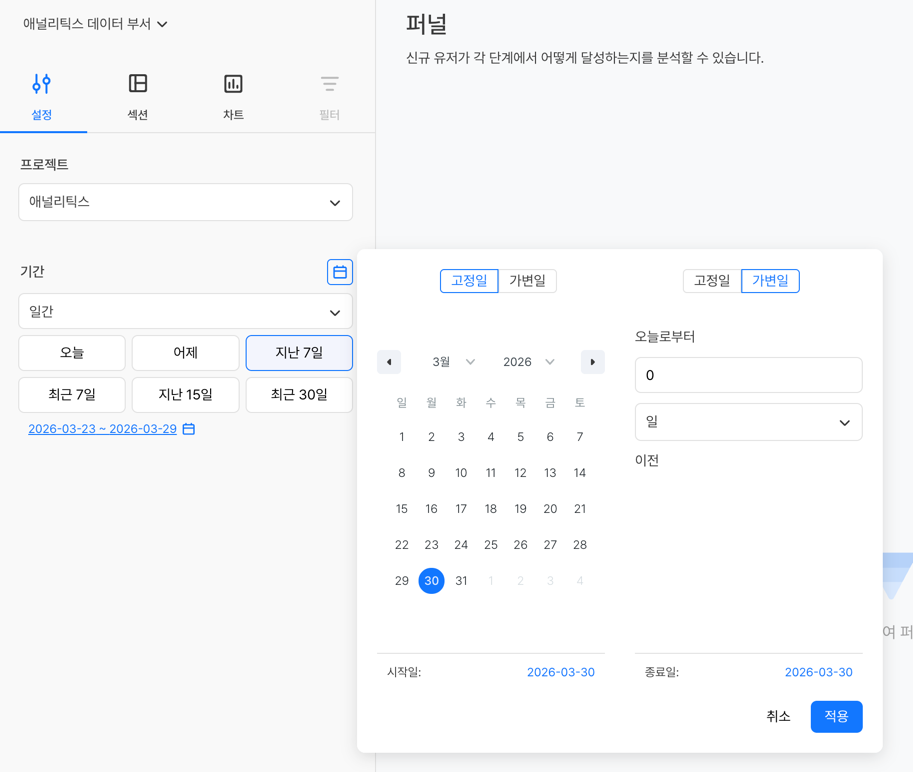
| Item | Required | Description |
|---|---|---|
| Project | Required | Select the project to analyze (single selection) |
| Date Range | Required | Select the start date and end date to analyze |
When you select a date range, you can use the quick select buttons or select dates directly with the calendar button.
The Recent and Last quick select buttons work with different reference dates.
| Type | Reference date | Example |
|---|---|---|
| Recent N days | Calculated from today's date | Recent 7 days → 7 days including today |
| Last N days | Calculated from yesterday's date | Last 7 days → 7 days including yesterday |
[Section] tab
The Section tab consists of the Common and Stage areas.
Common
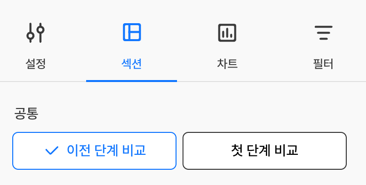
Select the comparison method to apply to the whole funnel.
| Comparison method | Description |
|---|---|
| Compare to Previous Stage | Shows the ratio of users who reached the current stage relative to the previous stage. Useful for checking the overall user retention rate or drop-off rate from the start stage to the end stage. |
| Compare to First Stage | Shows the ratio of users who reached each stage relative to the first stage. Useful for viewing users who reached multiple stages separately against a single reference stage. |
Stage
Configure funnel stages
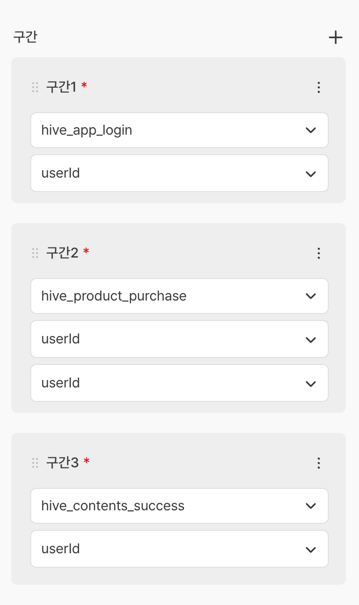
- Add stages with the
+button on the right side of the stage area. - Select the Event to track in each stage.
- You can change the stage order by drag and drop.
- You must set at least two stages.
Identifier settings
Select the identifier that user tracking is based on.
| Identifier | Description |
|---|---|
| userId | Tracks users by account. |
| deviceId | Tracks users by device. |
Stage filters
You can set an individual filter on each stage so that only events that meet specific conditions are used as the data for that stage.
For example, if you add the newUser attribute of the hive_app_login event as Y to stage 1, you can check funnel data for new users.
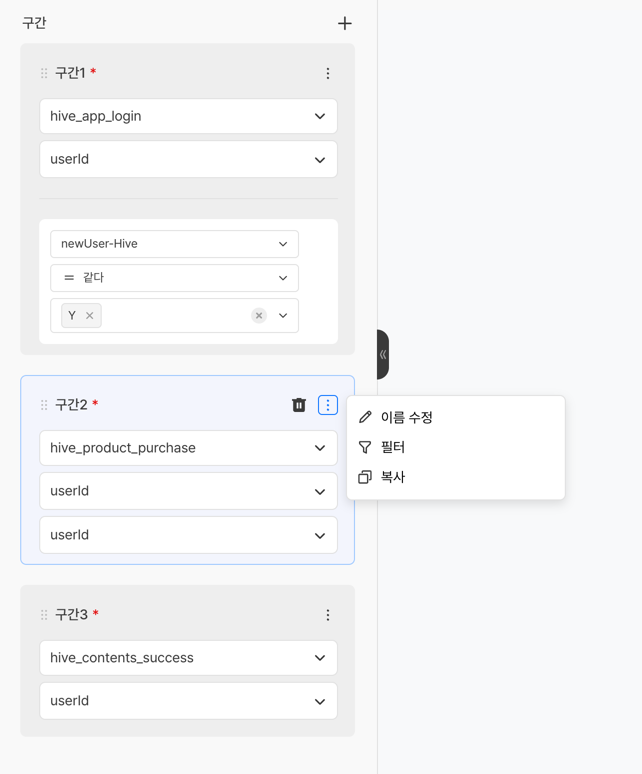
The attributes you can filter on are shown based on the attributes of the selected event, and the condition operators you can select are as follows.
| Operator | Description |
|---|---|
| Equals | Includes only data that exactly matches the entered value. Example: view only users whose country is "Korea" or "Japan" |
| Not Equals | Includes only data that does not match the entered value. Example: view only users whose OS is not "Android" or "PC" |
| Less Than or Equal | Includes data that is less than or equal to the entered value. Example: view only cases where the payment amount is 10,000 KRW or less |
| Greater Than or Equal | Includes data that is greater than or equal to the entered value. Example: view only users whose level is 50 or higher |
| Range | Includes data that falls between the two entered values. Example: view only cases where the payment amount is at least 1,000 KRW and at most 10,000 KRW |
| No Value | Includes data where no value is recorded for the attribute. Example: view only users with no country information |
| Has Value | Includes data where at least one value is recorded for the attribute. Example: view only users with country information |
Note
The Greater Than or Equal, Less Than or Equal, and Range operators are not shown when the data type of the attribute is text.
- You can combine multiple filter conditions with the AND / OR operators.
- AND: Includes only data that meets both conditions.
- OR: Includes data that meets at least one of the two conditions.
[Chart] tab
Set the graph format and display method of the funnel preview.
Chart type
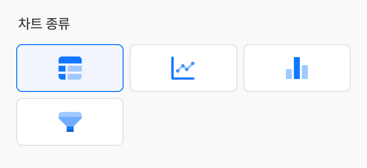
| Type | Main purpose |
|---|---|
| Funnel | Converts the achieved and unachieved status of each stage into percentages and displays it as a vertical graph. |
| Table | Displays the achieved and unachieved status of each reference period group, by stage and over the tracking period, as numbers and ratios. |
| Bar | Converts the achieved and unachieved status of each stage into percentages and displays it as a horizontal graph. |
| Line | Converts the achieved and unachieved status of users who completed all stages into percentages by day and displays it as a graph. |
Detailed visualization settings
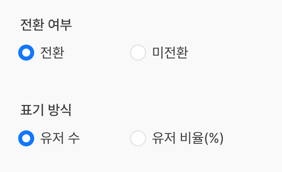
| Item | Description |
|---|---|
| Conversion Status | Select converted or not converted |
| Display Format | Select user count or user ratio (%) |
Tracking period
The period allowed for reference users to reach the funnel goal. It determines up to how many days after the day the start event occurred to aggregate progress figures. 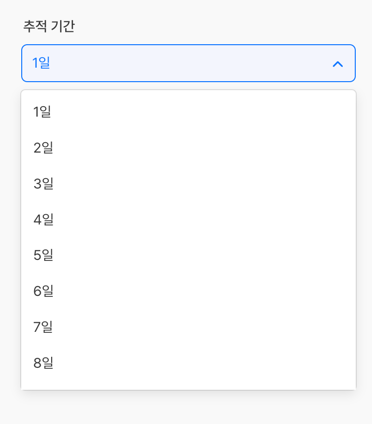
Example
If you set the query period to January 1 to January 5 and the tracking period to 10 days:
- Users with the reference date January 1 → progress through January 10 is aggregated
- Users with the reference date January 2 → progress through January 11 is aggregated
However, if the tracking period you set extends past the current time, only the figures up to the time of the query are shown.
Tip
Set it short when you need immediate decisions, such as for a purchase funnel, and long when you analyze flows that take time, such as onboarding.
Reference period
The unit period for extracting the users to analyze. You can divide the query period into this unit and compare the user groups of each interval separately. 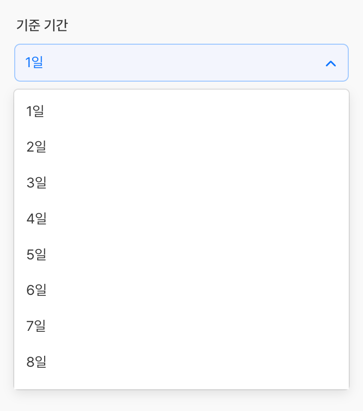
Example
If you set the query period to January 1 to January 5 and the reference period to 3 days:
- First interval: January 1 to January 3
- Second interval: January 4 to January 5
Even if the last interval is shorter than the reference period, only users up to the last day of the query period are included.
Edit a funnel
- In All Content, click the title of the funnel you want to edit to open its edit page.
- Change the settings in the tab you want.
- Click the Save button at the bottom.
Notes & tips
- Order matters in a funnel. Users must trigger the events in the defined order for them to count as a conversion.
- If you set a date range that includes a period when no events were sent, the data for that period is not displayed.
- It is natural for the conversion rate to drop as the number of stages grows. Include only the key stages in your analysis.