Retention
Overview
Retention is a feature that analyzes, based on the events created in Analytics, whether users who triggered a specific event at a specific time trigger events afterward.
You can analyze users' revisit and retention rates and use analysis by cohort to identify which cohorts have higher retention rates.
What can you do?
Business/marketing users
- You can set D+1 to D+30 retention as key KPIs and add them to a dashboard to monitor user retention status daily, weekly, or monthly.
- You can compare the retention of cohorts before and after a campaign to quantitatively measure whether the campaign contributed to revisits.
- You can identify retention differences by country to build content strategies suited to specific regions.
Data analysts
- You can compare the cohort from the time a new feature was released with earlier cohorts to analyze the feature's impact on retention.
- You can break down cohorts with dimensions to identify which user groups have higher retention rates.
- You can analyze the retention curve (the decline pattern of Nth-day retention) to find the tipping point of user churn.
Developers
- You can verify with the D+0 figure that event data is sent correctly.
- After adding a new event, you can set it as the reference event to confirm that its data is received.
Quick start
If you are creating a retention for the first time, follow the steps below to create your first retention.
- Click the Create button at the top, and then select Retention.
- At the top, select the workspace to save the retention in.
- In the [Settings] tab, set the project, period (daily/weekly/monthly), and date range to analyze.
- In the [Data] tab, select the reference event and the return event.
- Select the identifier (userId / deviceId).
- Check the retention figures in the preview on the right.
- Click the Save button at the bottom and enter the retention title and description.
Note
For detailed settings such as dimensions, filters, and visualization settings, see Full features.
Full features
Key concepts
| Concept | Description |
|---|---|
| Cohort | A set of users who triggered the reference event in the same period |
| Reference Event | The event that defines the cohort. Users who triggered this event are grouped into the cohort |
| Return Event | The event that measures retention. Tracks whether cohort users triggered this event afterward |
| Identifier | The user identification key (userId when account-based, deviceId when device-based) |
[Settings] tab
Enter the basic information of the retention. 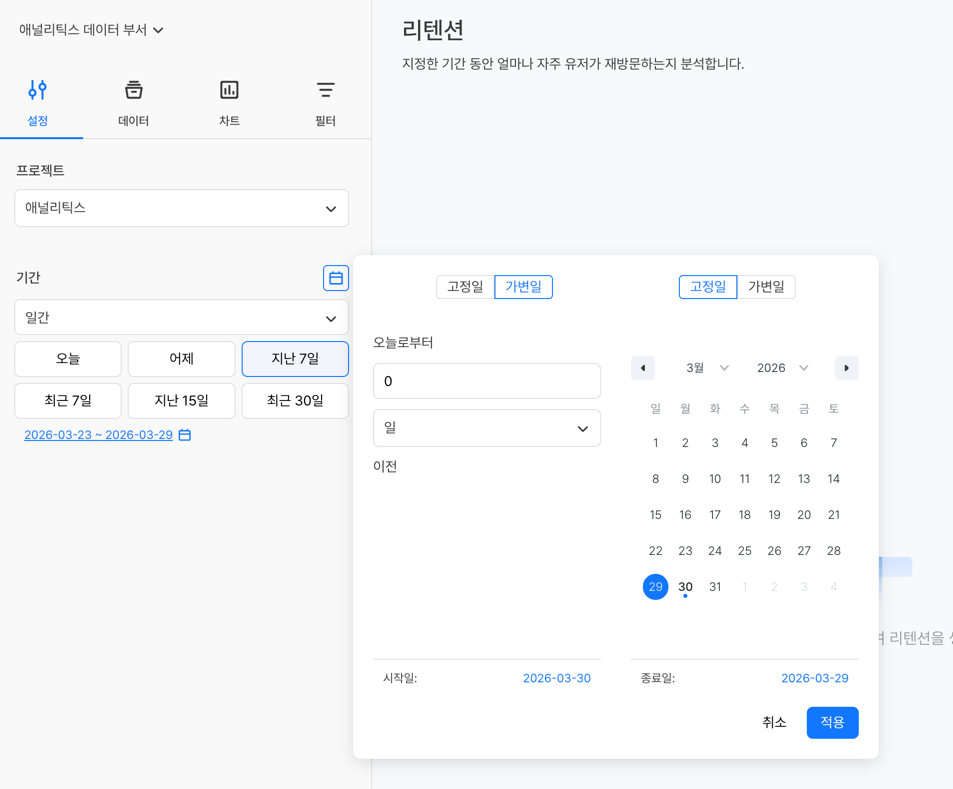
| Item | Required | Description |
|---|---|---|
| Project | Required | Select the project to analyze (single selection) |
| Period | Required | Select the cohort aggregation unit: daily / weekly / monthly |
| Date Range | Required | Select the period in which the reference and return events occurred |
When you select a date range, you can use the quick select buttons or select dates directly with the calendar button.
The Recent and Last quick select buttons work with different reference dates.
| Type | Reference date | Example |
|---|---|---|
| Recent N days | Calculated from today's date | Recent 7 days → 7 days including today |
| Last N days | Calculated from yesterday's date | Last 7 days → 7 days including yesterday |
[Data] tab
Set the cohort definition and the retention measurement criteria.
Reference event
Select the event that forms the cohort. 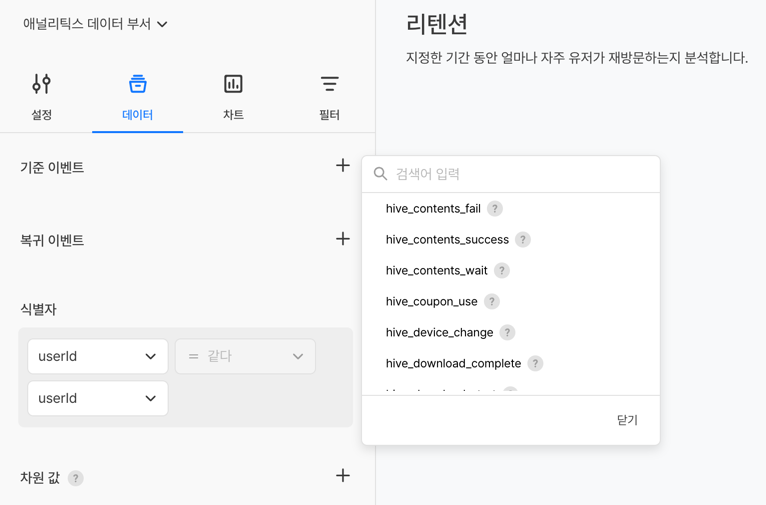
- Example:
hive_app_login→ Groups users who logged in during the period into a cohort - Example:
hive_character_level_change→ Groups users who leveled up a character into a cohort
Return event
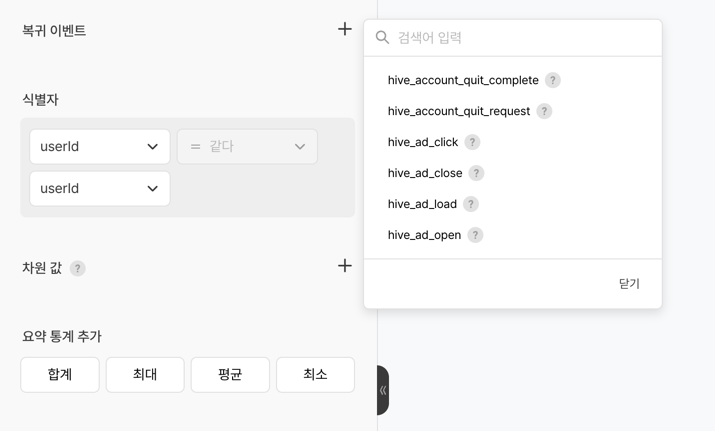
Select the event that measures the revisits or repeat actions of cohort users.
- Can be set to the same event as the reference event (example: login → re-login tracking)
- Can be set to a different event (example: login → in-app payment completed)
Identifier
Select the identifier that user tracking is based on.
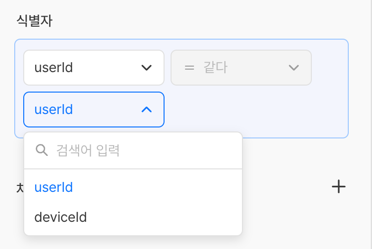
| Identifier | Description |
|---|---|
| userId | Tracks users by account. |
| deviceId | Tracks users by device. |
Dimension value
Analyze the cohort that triggered the reference event by breaking it down by specific attributes. 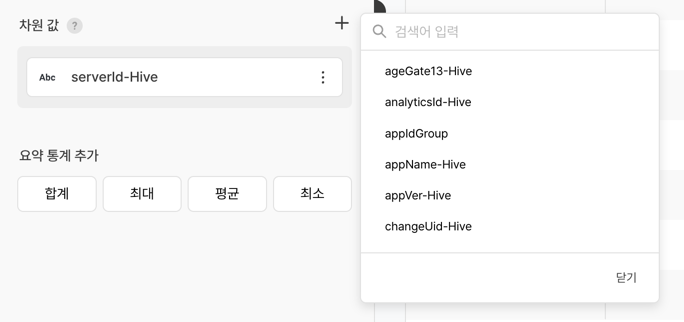
- Example: Divide cohorts by country to compare retention differences between countries
- Example: Divide cohorts by OS to compare retention rates by platform
Note
The items shown in the dimension value are based on the reference event attributes. In retention analysis, dimensions are the basis for breaking down cohorts (groups of users who triggered the reference event), so you cannot use the attributes of the return event as dimensions.
[Filter] tab
Set the filter conditions applied in common to the reference event and the return event added in the [Data] tab.
If you want to set a condition on a specific event only, use the individual event filter in the [Data] tab.
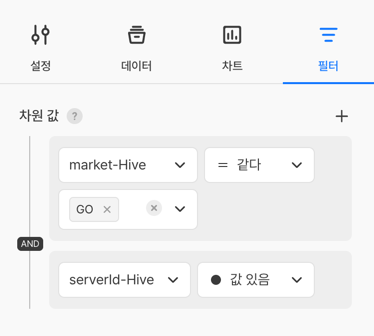
Select the filter target from Attribute and Segment.
- Reference Event Filter: Includes only reference events with specific attributes in the cohort
- Return Event Filter: Aggregates only return events with specific attributes as retention
Note
The items shown in the dimension of the filter include all attributes of both the reference event and the return event. If a specific event does not have that attribute, the filter is not applied to that event.
Filter condition operators
| Operator | Description |
|---|---|
| Equals | Includes only data that exactly matches the entered value. Example: view only users whose country is "Korea" |
| Not Equals | Includes only data that does not match the entered value. Example: view only users whose OS is not "Android" |
| Less Than or Equal | Includes data that is less than or equal to the entered value. Example: view only cases where the payment amount is 10,000 KRW or less |
| Greater Than or Equal | Includes data that is greater than or equal to the entered value. Example: view only users whose level is 50 or higher |
| Range | Includes data that falls between the two entered values. Example: view only cases where the payment amount is at least 1,000 KRW and at most 10,000 KRW |
| No Value | Includes data where no value is recorded for the attribute. Example: view only users with no country information |
| Has Value | Includes data where at least one value is recorded for the attribute. Example: view only users with country information |
Note
The Greater Than or Equal, Less Than or Equal, and Range operators are not shown when the data type of the attribute is text.
- You can combine multiple filter conditions with the AND / OR operators.
- AND: Includes only data that meets both conditions.
- OR: Includes data that meets at least one of the two conditions.
Segment filter
If you select a segment as a filter, only the data of users who belong to that segment is reflected in the retention. Depending on how you combine segment conditions, you can use it in two ways: Dynamic Cohort and Static Cohort.
| Method | Condition combination | Meaning |
|---|---|---|
| Dynamic Cohort | Select a segment only | Recalculates the segment conditions every time you view the retention and reflects the users who match the current conditions. |
| Static Cohort | Select a segment and a segment snapshot together | Fixed to the user list at the specific point in time when the segment snapshot was created. Even if user status changes later, the reflected set of users does not change. |
Tip
- If you want to see the users who meet the conditions right now in real time → Dynamic Cohort (select a segment only)
- If you want to analyze users fixed at a specific point in time, such as the campaign start date → Static Cohort (select a segment + snapshot)
For how to create segments and segment snapshots, see the Segment document.
[Chart] tab
Set how retention results are presented.
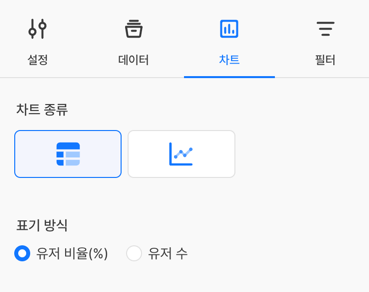
Chart type
| Type | Main purpose |
|---|---|
| Table | Displays the D+0 to D+N retention figures of each cohort in a table. Suitable for comparing exact figures by cohort. |
| Line Chart | Shows the retention decline trend of a specific cohort as a line. Suitable for identifying the pattern of changes in the retention rate for each Nth day. |
Detailed visualization settings
| Item | Description |
|---|---|
| Display Unit | Select user ratio (%) or user count |
Add summary statistics
When the chart type is 'Table', this feature also displays the aggregate statistics for the entire selected period. You can check statistical figures while viewing the retention trend.
| Statistic | Description |
|---|---|
| Total | The sum of all figures during the selected period |
| Average | The average of the figures during the selected period |
| Min | The lowest figure during the selected period |
| Max | The highest figure during the selected period |
Edit retention
- In All Content, click the title of the retention you want to edit to open its edit page.
- Change the settings in the tab you want.
- Click the Save button at the bottom.
Notes & tips
- Period selection matters: Daily cohorts suit detailed analysis, and weekly or monthly cohorts suit long-term trend analysis.
- If the date range is too short, the long-term retention (such as D+30) of recent cohorts may not be aggregated.
- The D+0 figure is always 100%. If later figures are shown as 0%, there may be no data for that period, or the event name may be set incorrectly.
- Retention figures are not continuous retention rates. Because the ratio of users who triggered the return event on each day is aggregated independently, the D+3 figure can be higher than the D+1 figure.
- If you set the reference event and the return event to the same event, you can measure the revisit rate (reconnection rate).