Dashboard
Overview
Dashboard is a feature that combines the content you created with the chart, funnel, and retention features on a single page so that you can analyze a series of data performance results for a purpose.
You can share data analysis results within your team or organization for efficient communication and collaboration.
What can you do?
Business/marketing users
- Gather key KPIs such as DAU, ARPU, and conversion rate on one screen to see the key status as soon as you open Analytics every morning.
- Share analysis results with team members immediately to greatly reduce the time spent writing separate reports.
- Create a dedicated dashboard with the campaign period as its date range to monitor performance closely.
- Check the status of key KPIs even on the go with the mobile dashboard.
Data analysts
- Organize dashboards by analysis purpose to manage your team's analysis assets systematically.
- Compare data from different periods side by side on the same screen.
- Leave insights and comments next to charts with text panels to share the analysis context with your team.
Developers
- Create a dedicated dashboard right after deploying a new event to check the status of the data pipeline in real time.
Quick start
If you are creating a dashboard for the first time, follow these steps to create your first dashboard.
- Click the Create button at the top and select Dashboard.
- At the top, select the workspace to save the dashboard in.
- On the [Settings] tab, set the period (default/daily/weekly/monthly/hourly/minute) and the date range.
- Click the
+button in the preview area on the right. - Select the panel type to add (content/text/image) and add it as a panel.
- Adjust the size and position of the panel by dragging.
- Click the Save button at the bottom and enter the dashboard title and description.
Note
For detailed settings such as filters, sharing, and main dashboard settings, see Full features.
Full features
Key concepts
| Concept | Description |
|---|---|
| Panel | An individual chart, funnel, retention, text, or image content item placed on a dashboard |
| Dashboard Filter | A condition filter applied to all panels in the dashboard at once |
[Settings] tab
Enter the basic information of the dashboard.
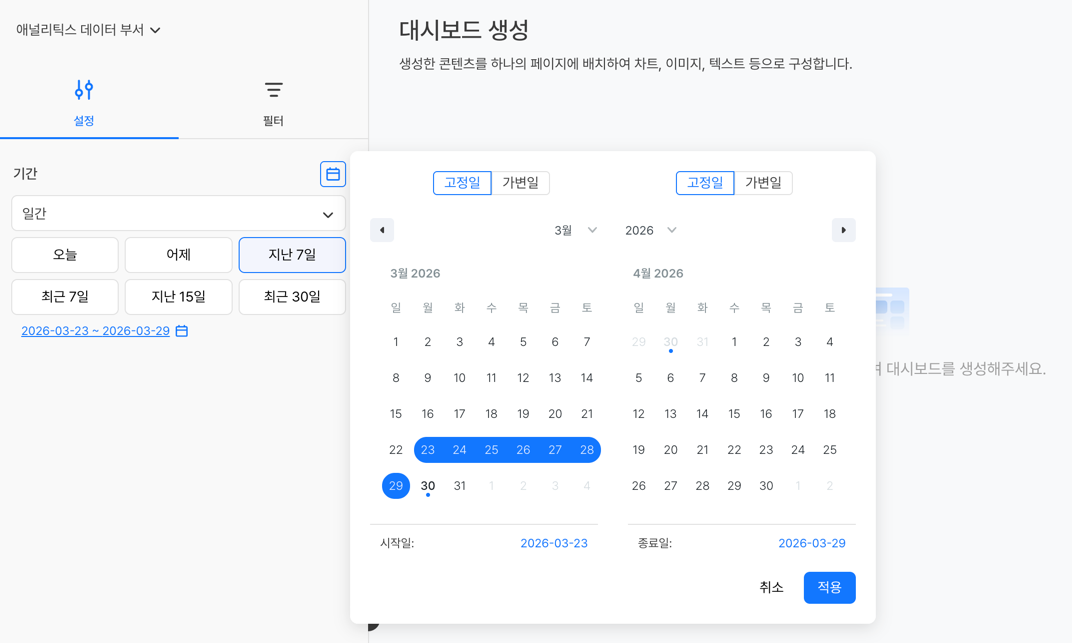
| Item | Required | Description |
|---|---|---|
| Period | Optional | The period unit applied to all panels (daily/weekly/monthly/hourly/minute) |
| Date Range | Optional | The date range applied to all panels |
When you select a date range, you can use the quick select buttons or select dates directly with the calendar button.
The Recent and Last quick select buttons use different reference dates.
| Type | Reference date | Example |
|---|---|---|
| Recent N days | Calculated based on today | Recent 7 days → 7 days including today |
| Last N days | Calculated based on yesterday | Last 7 days → 7 days including yesterday |
Note
If you set a dashboard-level date range, the dashboard setting takes precedence over the date ranges of individual panels. To apply a different date range to each panel, select 'Default' for the period.
[Filter] tab
Set common filters to apply to the entire dashboard.
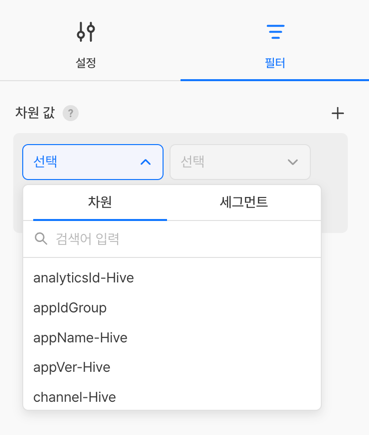
- You can add a filter by choosing either a dimension or a segment, and the added filter is applied to all panels in the dashboard at once.
- You can combine filter conditions with the AND / OR logical operators.
Note
The items shown in the filter's dimension are the attributes of all events used to build the panels. If a specific panel does not have the attribute, the filter does not apply to that panel.
Add and manage panels
Add a panel
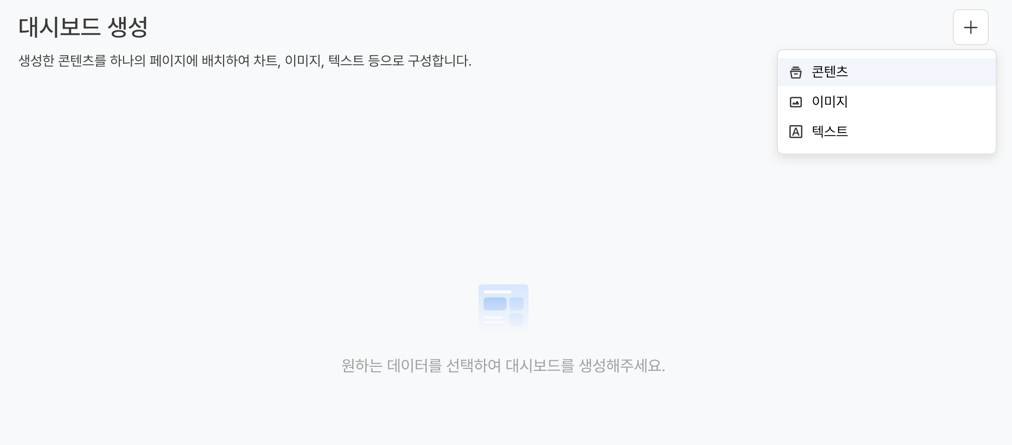
- Click the
+button in the preview area. - Select the panel type to add.
| Content type | Description |
|---|---|
| Content | Select chart, funnel, or retention content you created earlier |
| Text | Enter text such as the analysis scope or insights |
| Image | Upload an image file |
Panel notes
You can add a note to each panel. Use it to leave remarks about a chart, analysis comments, and so on for each panel. 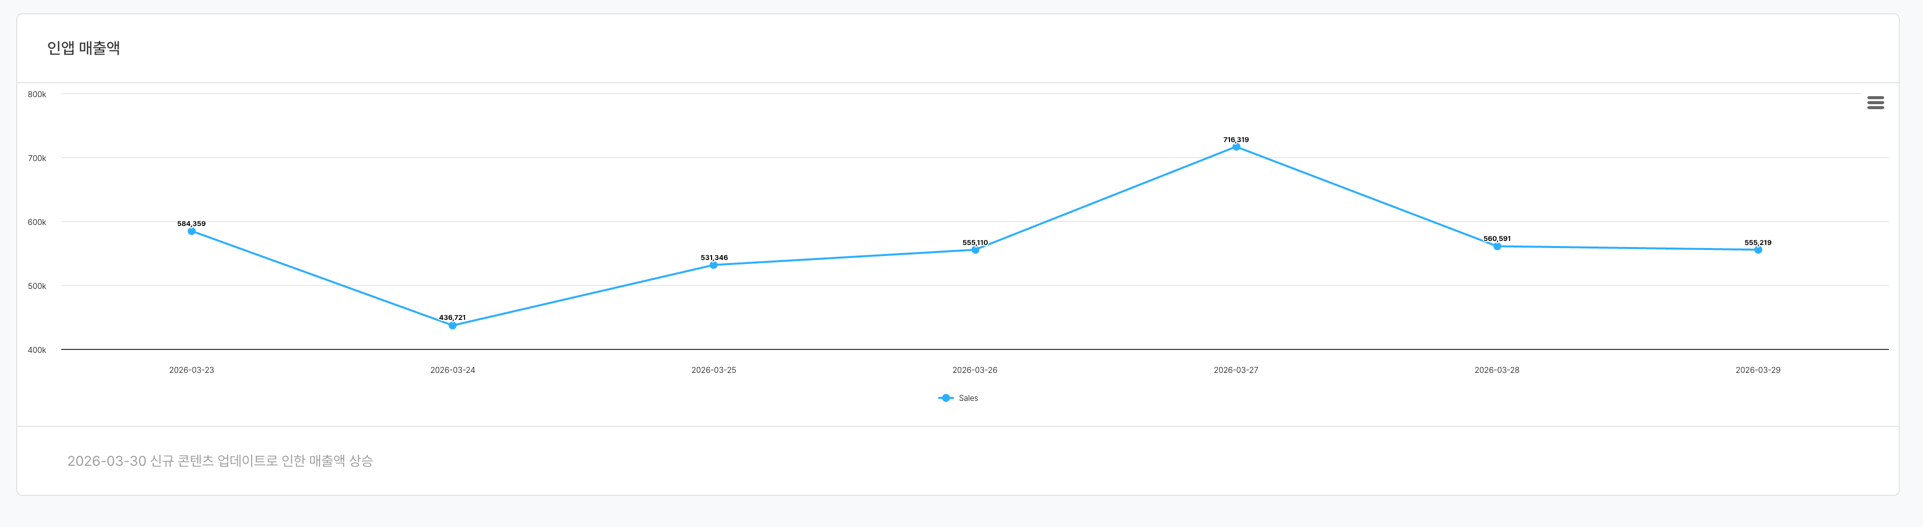
- On the dashboard create or edit page, click the ... button of the panel to add a note to.
- Click Note and enter the content.
Resize panels
You can place up to four panels in a row, and you can freely adjust their size and position by dragging.
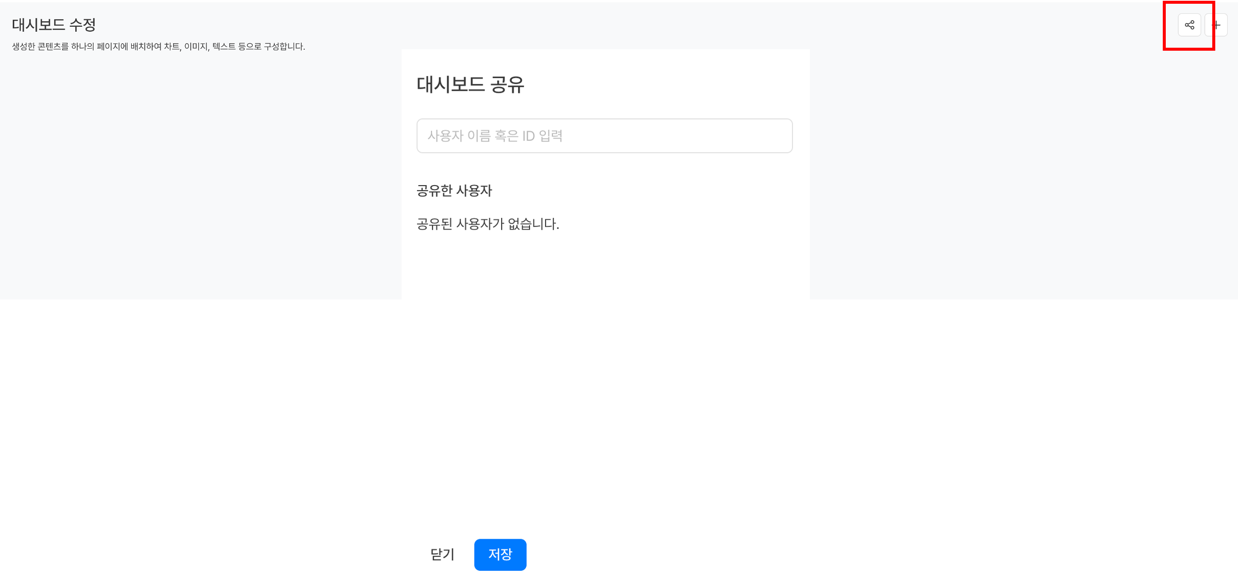
Set up sharing
You can set up sharing for a created dashboard on the Dashboard edit page.
You can share a dashboard with users in your company regardless of their workspace access permissions, and the users you share it with can access the dashboard within the scope of the granted permission.
| Permission | Description |
|---|---|
| Viewer | Can only view the dashboard |
Warning
Users without workspace access permission can also access the dashboard through sharing. Choose who to share with carefully.
View dashboards
Switch dashboards

Select a dashboard in the navigation sidebar on the left to switch directly to another dashboard.
Adjust the date range
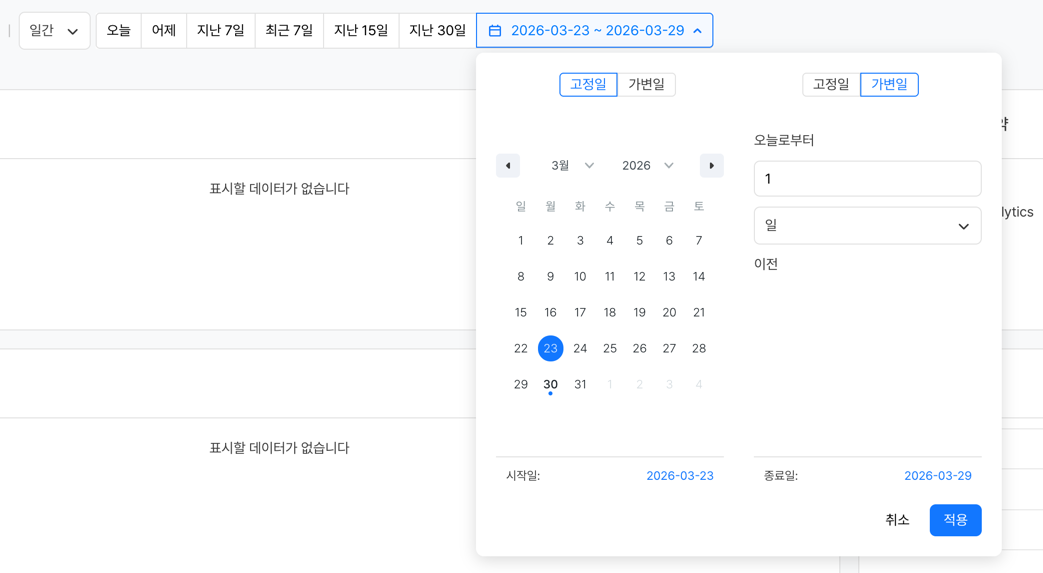
If you change the date range on the view screen, the change is applied to all panels in the dashboard at once. You can set it with a quick select button (for example, Last 30 days) or by entering dates directly.
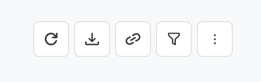
Top action buttons
| Button | Description |
|---|---|
| Refresh | Reloads all dashboard data. |
| Download | Saves the dashboard as a PDF or PNG file. |
| Copy Link | Copies the URL of the current dashboard to the clipboard. You can quickly share it with other users through the link. |
| Filter | Sets conditions to apply to all panels. |
| ... | Accesses additional features such as editing. |
View dashboards on mobile
When you access Analytics from a mobile device, you can view the dashboards you configured on a PC in the same way on mobile. 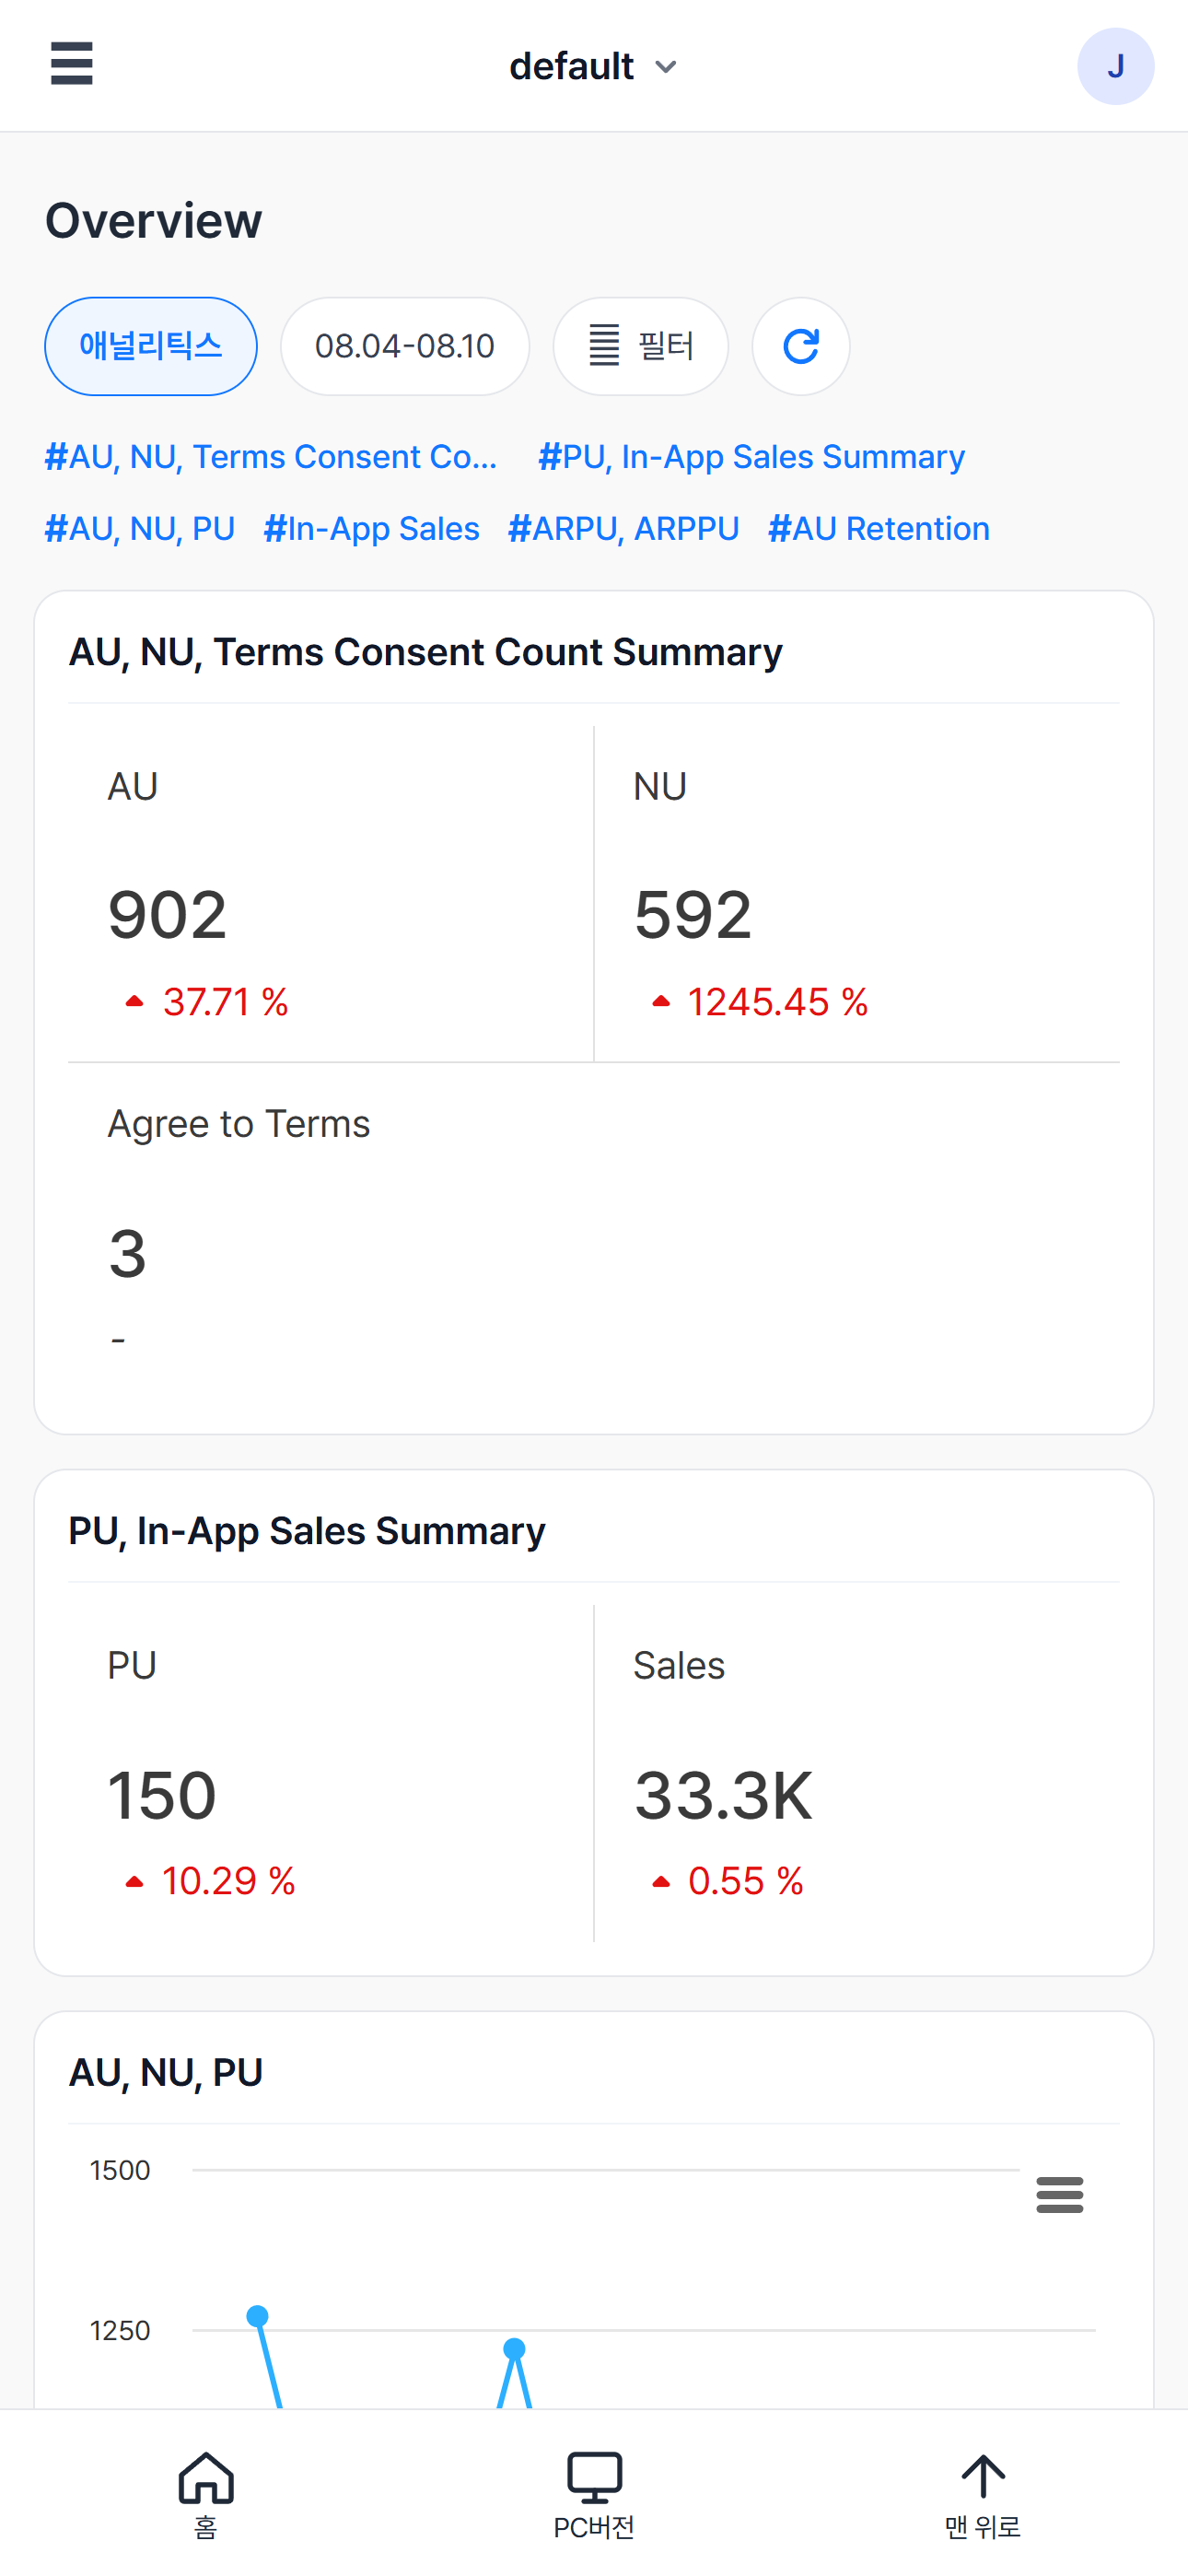
You can set the query period and filters on the screen to view the data.
Creating and editing dashboards is not supported on mobile.
Edit a dashboard
- Click the ... button in the upper-right corner of the dashboard view page and select Edit.
- Change the settings on the tab or in the layout area you want.
- Click the Save button at the bottom.
Notes & tips
- If the original content (chart, funnel, or retention) of a panel added to a dashboard is deleted, the panel is not displayed.
- Use text panels to add section dividers, descriptions of the analysis purpose, and so on to improve readability.
Related menus
- Home — The screen where you check the main dashboard
- Chart — Create charts to add to dashboards
- Funnel — Create funnels to add to dashboards
- Retention — Create retention analyses to add to dashboards
- Workspace management — Specify the main dashboard